





No CrossRef data available.
Article contents
Oh, the number of things you will process (in parallel)!
Published online by Cambridge University Press: 24 May 2017
Abstract
We highlight the importance of considering the variance produced during the parallel processing stage in vision and present a case for why it is useful to consider the “item” as a meaningful unit of study when investigating early visual processing in visual search tasks.
Information
- Type
- Open Peer Commentary
- Information
- Copyright
- Copyright © Cambridge University Press 2017
References
Balas, B., Nakano, L. & Rosenholtz, R. (2009) A summary-statistic representation in peripheral vision explains visual crowding. Journal of Vision
9(12):13, 1–18.Google Scholar
Bravo, M. J. & Nakayama, K. (1992) The role of attention in different visual-search tasks. Perception and Psychophysics
51:465–72. doi: 10.3758/BF03211642.Google Scholar
Buetti, S., Cronin, D. A., Madison, A. M., Wang, Z. & Lleras, A. (2016) Towards a better understanding of parallel visual processing in human vision: Evidence for exhaustive analysis of visual information. Journal of Experimental Psychology: General
145(6):672–707.Google Scholar
Ester, E. F., Klee, D. & Awh, E. (2013) Visual crowding cannot be wholly explained by feature pooling. Journal of Experimental Psychology: Human Perception and Performance
40(3):1022–33.Google ScholarPubMed
Ester, E. F., Zilber, E. & Serences, J. T. (2015) Substitution and pooling in visual crowding induced by similar and dissimilar distractors. Journal of Vision
15(1):4, 1–12.Google Scholar
Lamy, D. & Kristjánsson, A. (2013) Is goal-directed attentional guidance just intertrial priming? A Review. Journal of Vision
13(3):14, 1–19.Google Scholar
Li, W., Piëch, V. & Gilbert, C. D. (2004) Perceptual learning and top-down influences in primary visual cortex. Nature Neuroscience
7(6):651–57.Google Scholar
Li, W., Piëch, V. & Gilbert, C. D. (2006) Contour saliency in primary visual cortex. Neuron
50(6):951–62.Google Scholar
Neider, M. B. & Zelinsky, G. J. (2008) Exploring set size effects in scenes: Identifying the objects of search. Visual Cognition
16(1):1–10.Google Scholar
Rosenholtz, R., Huang, J., Raj, A., Balas, B. J. & Ilie, L. (2012b) A summary statistic representation in peripheral vision explains visual search. Journal of Vision
12(4):14, 1–17. doi: 10.1167/12.4.14.Google Scholar
Wolfe, J. M. (1994) Guided search 2.0: A revised model of visual search. Psychonomic Bulletin and Review
1(2):202–38.Google Scholar
Wolfe, J. M., Alvarez, G. A., Rosenholtz, R. E., Kuzmova, Y. I. & Sherman, A. M. (2011a) Visual search for arbitrary objects in real scenes. Attention, Perception, and Psychophysics
73:1650–71. doi: 10.3758/s13414-011-0153-3.Google Scholar
Zelinsky, G. J. (2008) A theory of eye movements during target acquisition. Psychological Review
115:787–835. doi: 10.1037/a0013118.Google Scholar
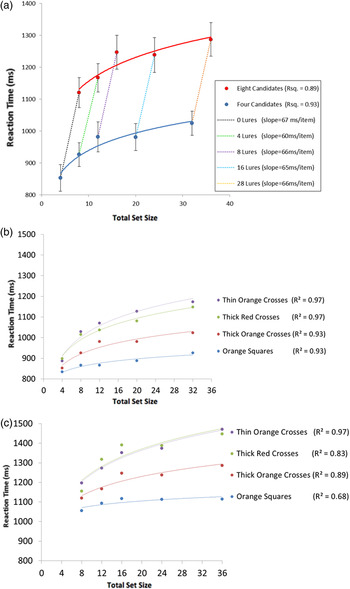
Figure 1. Results from Experiments 3A–D in Buetti et al. (2016) showing time (in ms) to find a target (an oriented red T) as a function of the number of elements in the display, shown separately for displays containing 4 and 8 candidates (oriented red Ls), amongst a varying number of lures. The full lines show the best fitting logarithmic trend for each series, and the corresponding measure of fit (R2). A. Data from Experiment 3A: The dotted lines visualize the scrutiny functions for each level number of lures. The slopes for the scrutiny function when no lures were presented (0 lures) was 67 ms/item and was no different than when 4, 8, 16, or 28 lures were present. Error bars indicate the between-subject standard error of the means. B–C. Combined data from Experiments 3A–D showing logarithmic screening functions when 4 (B) or 8 (C) candidates are present in the display, showing orderly logarithmic sensitivity to target–lure dissimilarity.
 You have
Access
There is much to like about Hulleman & Olivers' (H&O's) proposal. However, the article falls short on at least two fronts. Mostly, it suffers from over-generalizations in its core assumptions that limit the potential of the article.
First, it assumes that early visual computations are identical, irrespective of the type of visual search an observer is asked to perform. However, there is strong evidence that the type of early computations performed by the visual system are fundamentally different when searching for a known target (e.g., look for a “T”) than when looking for an unknown target (as in oddball search), even when that unknown target “pops-out” from the distractors by virtue of its features (e.g., Bravo & Nakayama Reference Bravo and Nakayama1992; Buetti et al. Reference Buetti, Cronin, Madison, Wang and Lleras2016; Lamy & Kristjánsson Reference Lamy and Kristjánsson2013; also see Li et al. Reference Li, Piëch and Gilbert2004; Reference Li, Piëch and Gilbert2006, for neural evidence that top-down goal changes early visual processing).
Second, ample evidence exists that much can be performed in searches that do not require eye movements. The authors acknowledge, then quickly dismiss, this observation by assuming all “easy” search (i.e., parallel search) can be accounted for by simply assuming a very large FVF. On this front, H&O's proposal is no better than previous proposals that assume all parallel searches are created equal (e.g., Wolfe Reference Wolfe1994). They are not. What is remarkable is that at that scale – that is, in visual searches that are performed in parallel and without the need for eye movements – the “single item” is a meaningful unit of measurement: For a fixed-target search, RTs increase logarithmically as a function of the number of items and the steepness of that logarithmic curve is determined by the similarity between the target and the individual items (Buetti et al. Reference Buetti, Cronin, Madison, Wang and Lleras2016). The result of glossing over the subtleties of parallel search is that H&O's remains very much a univariate approach to visual search: determining the FVF (or the size of the pooling region, as in Rosenholtz' work) should be all that is needed to understand search performance in any situation. Dismissing very efficient searches as not interesting seems to us to miss an important point. In the real world, peripheral vision can and probably does make very fast and accurate decisions about many regions/pooling regions/textures/items/objects because it has sufficient information to determine which ones are unlikely to contain the target of the search (Balas et al. Reference Balas, Nakano and Rosenholtz2009; Rosenholtz et al. Reference Rosenholtz, Huang, Raj, Balas and Ilie2012b, though see other work challenging the notion of peripheral “pooling” or averaging regions, Ester et al. Reference Ester, Klee and Awh2013; Reference Ester, Zilber and Serences2015). Our work shows that these peripheral decisions come at an detectable performance cost. That is, in addition to the serial processing mechanism imposed by successive moves of the FVF proposed by the authors, an additional source of variance in performance determines the time it takes to reach decisions about individual peripheral items within the parallel processing stage. Visual search is (at the very least) a bi-variate problem: one source of variance determines the number of serial steps in processing (the authors propose the size of the FVF), and another source determines the efficiency with which individual items are judged in the parallel process. This was highlighted in four experiments in Buetti et al. (Reference Buetti, Cronin, Madison, Wang and Lleras2016): When search displays contain both easy-to-reject items (lures) and need-to-scrutinize items (candidates), one can isolate the logarithmic contribution to RTs that arise from parallel processing (i.e., the rejection of lures) from the linear contribution to RTs induced by serial processing (i.e., the scrutiny of candidates, or as the authors propose, the number of moves of FVF). Figure 1 illustrates how both sources of variances can be disentangled and visualized by plotting separate RT functions for conditions containing an identical number of candidates.
Results from Experiments 3A–D in Buetti et al. (Reference Buetti, Cronin, Madison, Wang and Lleras2016) showing time (in ms) to find a target (an oriented red T) as a function of the number of elements in the display, shown separately for displays containing 4 and 8 candidates (oriented red Ls), amongst a varying number of lures. The full lines show the best fitting logarithmic trend for each series, and the corresponding measure of fit (R2). A. Data from Experiment 3A: The dotted lines visualize the scrutiny functions for each level number of lures. The slopes for the scrutiny function when no lures were presented (0 lures) was 67 ms/item and was no different than when 4, 8, 16, or 28 lures were present. Error bars indicate the between-subject standard error of the means. B–C. Combined data from Experiments 3A–D showing logarithmic screening functions when 4 (B) or 8 (C) candidates are present in the display, showing orderly logarithmic sensitivity to target–lure dissimilarity.
Finally, it is quite unlikely that fixations are random, as proposed by the authors. They are likely determined by the output of the computations in areas outside of the FVF, as proposed by models such as Zelinsky's TAM (Reference Zelinsky2008), for example, and performed mostly by parallel processing as well.
In sum, though we agree with the sentiment that overly-focusing on the “single-item” has perhaps lead astray researchers interested in inefficient search, we anticipate a revival of interest on the single item as meaningful for understanding search behavior. This revival will come not where most would have expected (or where most have looked) – in serial/slow searches – but rather precisely where most (including H&O) have ignored: in parallel search. This follows because in the context of parallel visual search, manipulating the number of (high signal-to-noise ratio) items in the periphery allows for a precise quantification of the efficiency of parallel processing and of the similarity between the peripheral items and the search template. Of course, one might wonder whether this is at all relevant to our understanding of real-world visual search. Given the visual heterogeneity of a real world scene, the number of items that ought to be closely inspected by focused attention is likely to be only a fraction of the total (Neider & Zelinsky Reference Neider and Zelinsky2008; Wolfe et al. Reference Wolfe, Alvarez, Rosenholtz, Kuzmova and Sherman2011a). Take the simple example of looking for lawn furniture in your garden: in spite of there being an very large number of items in the scene (flowers, trees, grass, animals, etc.), most of them are vastly different from lawn furniture and one would never spend time closely attending to them when looking for a place to sit. Yet, as our research has shown, the presence and visual attributes of these not-to-be-inspected items do affect the time it will take observers to find a place to sit.
Nonetheless, these shortcomings are clearly fixable and a better account of the contribution of parallel vision to behavioral performance can be easily integrated into the H&O proposal. Future empirical work should be aimed at estimating the contribution of peripheral processing both outside of FVF and within FVF to (a) planning future eye movements and (b) predicting fixation processing times.