



R.1. More data are needed
I shall start with the issue of data and, perhaps more importantly, with the issue of quantification. I shall argue that the lack of quantification tends to generate some confusion in the conceptualization of the Industrial Revolution. Without any quantification, we are indeed tempted to focus on a few “macro-inventions,” such as the steam engine, the flying jenny, and the coke blast furnace, or to conceptualize the Industrial Revolution as the shift between two radically different kinds of economic processes, from agriculture to industry, from organic (animal, human energy) to inorganic (fuel, water) energy, or from human to mechanical processes of production. But there were much more than a few macro-inventions during the Industrial Revolution. As I said repeatedly in the target article (following historians of technology), the Industrial Revolution is best conceptualized as an increase in innovativeness: there were more innovations in every domain, in textiles, in metallurgy, in mining, et cetera. Likewise, dichotomic classifications (agriculture/industry, organic/inorganic) are always problematic. It is difficult to pinpoint a period for the beginning of the rise of industry, machines, and inorganic energy. What we observe instead is a continuous process of increasing innovativeness and increasing mechanization.
Maybe the best way to understand the nature of the Industrial Revolution and the need for quantification is to have a look at the evolution of income per capita in England over the last 800 years (Broadberry et al. Reference Broadberry, Campbell, Klein, Overton and van Leeuwen2015, Fig. 1). From the perspective of GDP per capita, the Industrial Revolution looks hardly like a revolution. It is only the first noticeable acceleration in economic growth (which is actually the real Revolution). In the same way, we talk about the “Second Industrial Revolution” or the “Third Industrial Revolution” because these are convenient labels to describe how economic growth relied on different innovations (i.e., chemistry) and occurred in different countries (i.e., Germany, United States). But from a quantitative perspective, there is no discontinuity: economic growth just continued to increase.
Gross domestic product per capita in England since 1270. Reproduced, with permission from Broadberry et al. (Reference Broadberry, Campbell, Klein, Overton and van Leeuwen2015) via Bank of England (2017). Note that data refer to England until 1700 and the United Kingdom from then onward. OurWorldInData.org/economic-growth • Creative Commons BY license (open access).
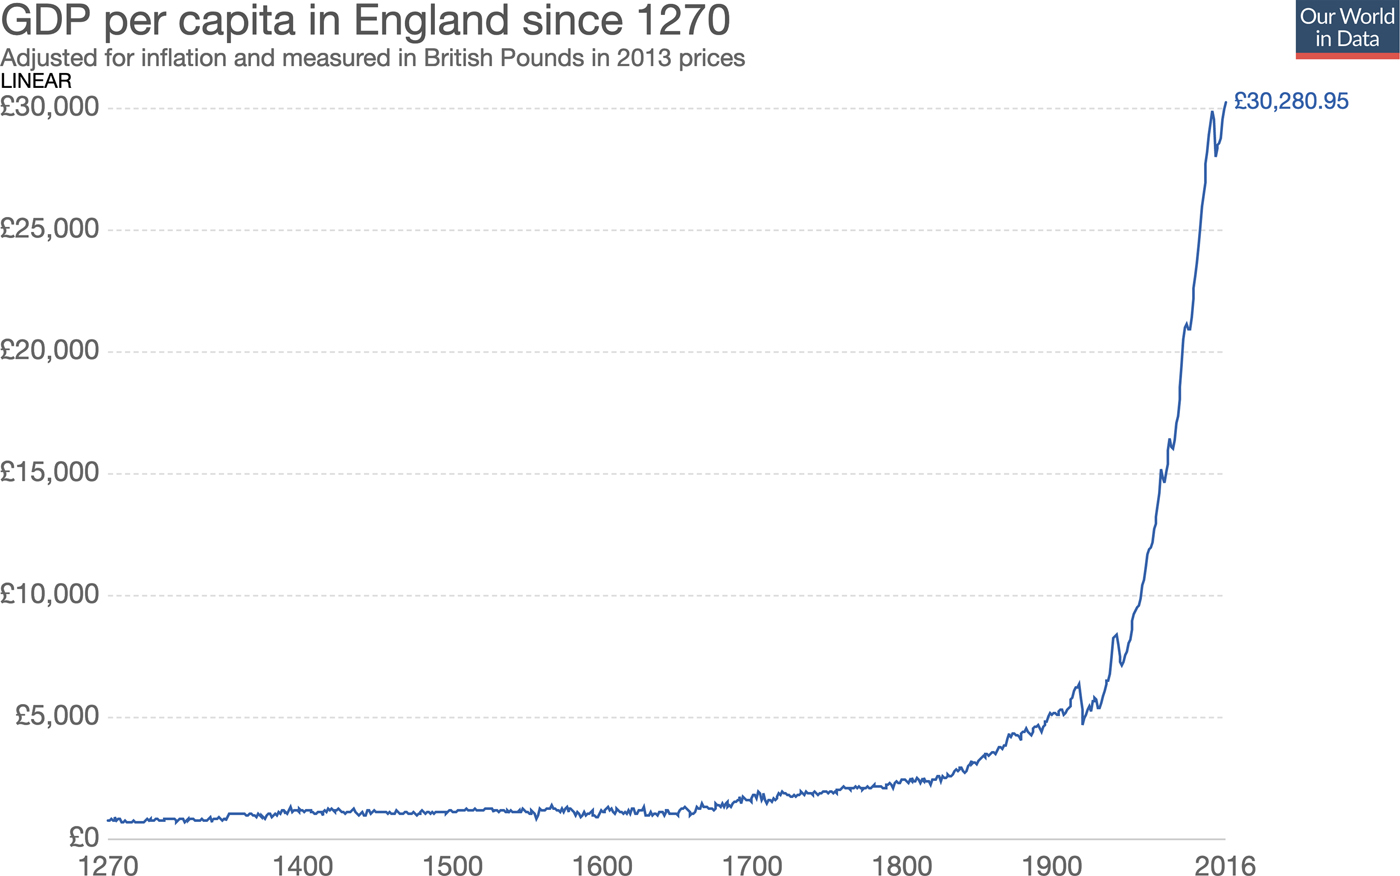
The most important lesson from this graph is that verbal labels such as the “Industrial Revolution” are great to raise awareness about a phenomenon (the scale of the acceleration of technological and economic production), but misleading when it comes to understanding it. Such verbal labels tend to dichotomize the world (i.e., industrial/pre-industrial) when in reality all changes are continuous (i.e., more or less technology, lower or higher income). This does not mean that there is nothing to be explained. The exponential nature of the rise in innovativeness and the “Great Enrichment” still requires an explanation. But we should not assume that the Industrial Revolution was an “event” or even a “short period.” It is rather part of a very general process of acceleration of cultural evolution, which is the phenomenon that requires an explanation: What made people more innovative? Was it institutions, natural resources, higher returns from investment in human capital (as advocated by Unified Growth Theory), new ideas, new genes (or higher frequencies of some alleles), or, as I have argued, increasing living standards and “slower” life history strategies? To answer this question, we first need more data, especially on innovativeness.
R1.1. More data on innovativeness
Many commentators have pointed out that the Life History Theory approach predicts that the Industrial Revolution should have developed not only in England, but also in other affluent countries, and in particular in Holland (Allard & Marie; Allen; Artige, Lubart, & van Neuss [Artige et al.]; Hewson; Seabright; Stephenson; Tainter & Taylor; Tasic & Buturovic). “If a ‘psychology of affluence’ developed in Great Britain, one would also expect it to have developed in Holland and to have brought about similar consequences” (Allard & Marie, para. 4).
I totally agree with the commentators: Life History Theory predicts that the richer a country is, the more innovative its people should be, and therefore, The Netherlands should have been more innovative during their Golden Age (seventeenth century) than other European countries and even more so than the English during the eighteenth century (for it is only in 1800 that England's gross domestic product [GDP] per capita reached the level reached by Holland in 1650).
Is it the case? Here, I think that we might again be victims of the paucity of quantification in the field. With Benoit du Buisson de Courson, we thus tried to quantify innovation during the early modern period across Europe (Baumard et al. Reference Baumard and du Bouisson de Courson2019). We focused on scientific discoveries and scientists, which are better documented than technological inventions and innovators (for databases of English innovators during the eighteenth and nineteenth centuries, see Allen Reference Allen2009b; Howes Reference Howes2016a; Meisenzahl & Mokyr Reference Meisenzahl, Mokyr, Lerner and Stern2012). Scientific and technological innovation are of course different in important ways, and many technological innovations did not directly rely on scientific innovations. Yet, quantifying scientific innovations still allows us to test the theory that richer countries should be more innovative.
We gathered all scientists from the period 1500–1850. We included all individuals that are classified as scientists in Wikipedia: mathematicians, astronomers, physicists, biologists, chemists, botanists, entomologists, zoologists, geographers, and cartographers. Importantly, data sets such as Wikipedia convey an inherent estimate of the importance of an innovation: the more numerous the productions of an individual, or the more important they were, and the bigger the biography.
We collected three proxies of the importance of an individual (Gergaud et al. Reference Gergaud, Laouenan and Wasmer2017): (1) length (number of bites in the Wikipedia page; (2) languages (number of languages into which the page is translated); (3) quotations (number of pages in Wikipedia containing a link toward this page). None of these indexes is perfect, and all have their biases, so we z-scored them and combine all three to create a more general index. To prevent a possible “linguistic bias” in favor of England, we ran this analysis in the three largest Wikipedias (English, German, and French) (see target article for more detail).
Our results are in line with modern accounts of the Scientific Revolution (Rossi Reference Rossi2001; Wootton Reference Wootton2015), with Italy and Germany leading in the sixteenth century, England and France during the seventeenth century (the century of the Scientific Revolution), and England, France, and Germany eventually taking the lead.
We then built an index of “scientific domestic product” per capita. Per capita estimates are crucial to estimate the innovativeness of the respective European countries. For example, we tend to consider that, in the modern period, Italy (with Galileo and Torricelli), England (with Newton and Boyle), and France (with Pascal and Descartes) were more or less equally productive scientifically. But this assessment neglects the fact that, in 1650, France had 16 million people, Italy 12 million, and England only 3 million. In other words, for England to contribute as much to the Scientific Revolution, it must have been much more productive than France or Italy.
In line with the Life History Theory approach, people in Holland were more innovative than any other Europeans during its Golden Age (Fig. R2) and were also more innovative than the English during most of the eighteenth century, in line with the fact that seventeenth-century Holland was more affluent than eighteenth-century England. So, did the “psychology of affluence” develop in seventeenth-century Holland? Yes, it did, and to the same extent as in England a century later.
Scientific production per capita. The period of high income (>$1500) and growth in gross domestic product per capita rate is in pink for The Netherlands and blue for the United Kingdom. Countries with very low scientific production (Spain, Portugal, Poland, Russia) are omitted.
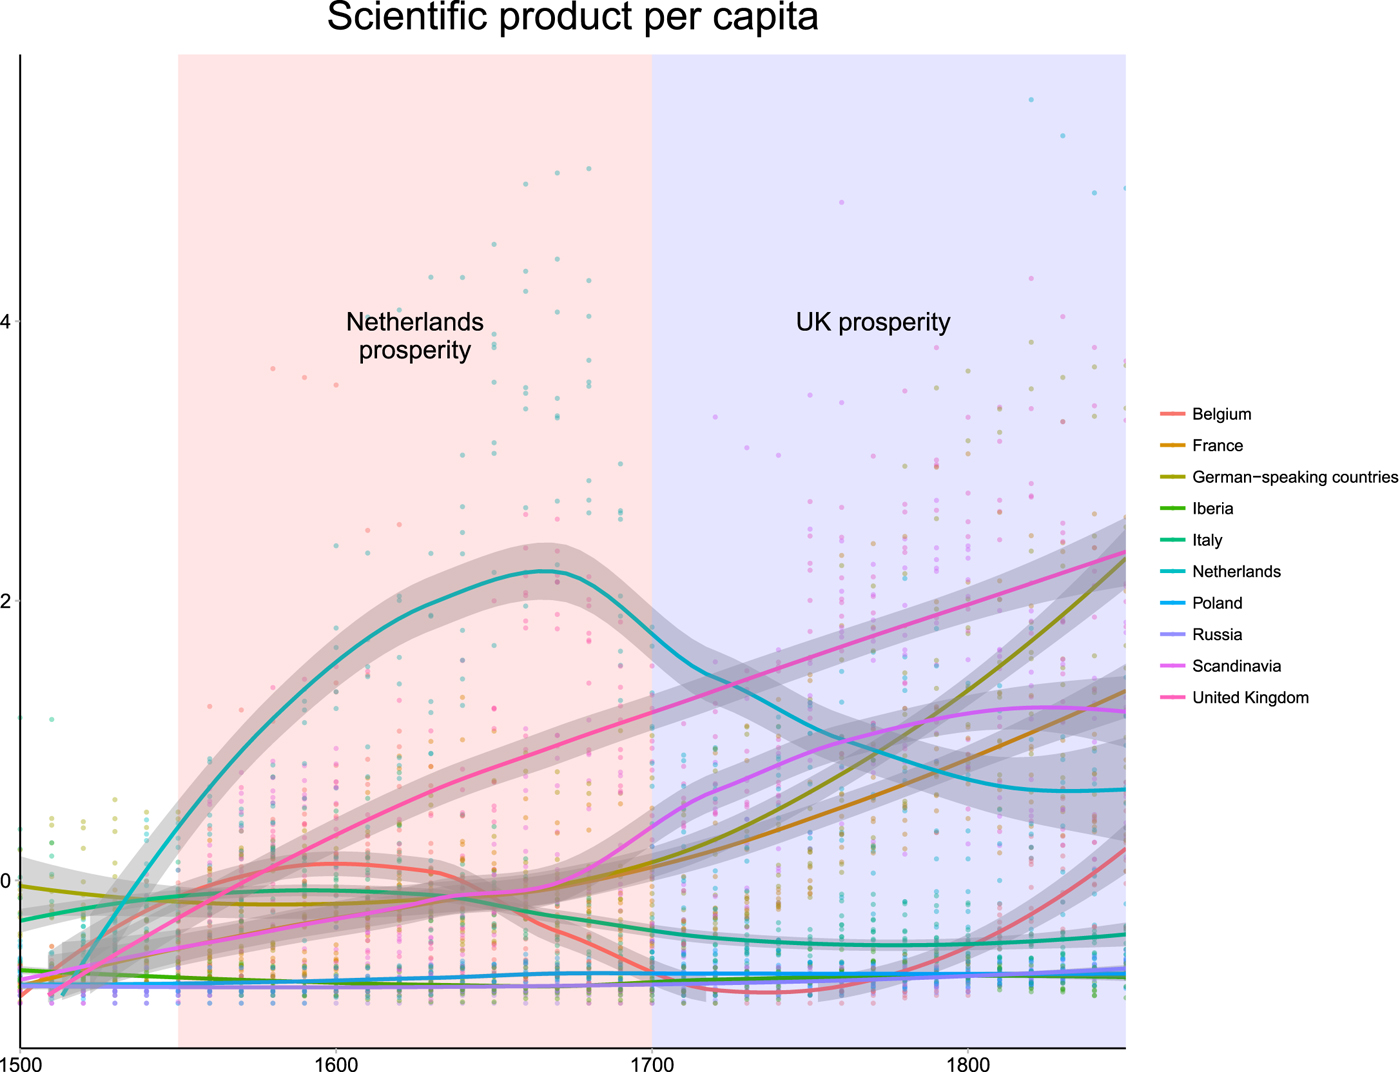
Commentators also asked why the Industrial Revolution did not take place in eighteenth-century Holland, still the richest country in the world. “Eighteenth-century England was not alone in having a high income. The Netherlands was the richest economy of the day, but the Industrial Revolution passed it by. Why?” (Allen, para. 8). Here, it is important to note that I place much emphasis on absolute income in the target article but the empirical literature is very clear about the fact that what matters is not only high income, but also sustained and predictable income (I return to this issue in sect. R2.5 when discussing the respective role of poverty, unpredictability, and inequality). In fact, despite its affluence, eighteenth-century Holland was in a drastically different situation than eighteenth-century England. From 1650 on, Holland indeed experienced an important economic crisis, with a 30% decline in urbanization rates and a 20% decline of GDP per capita. This economic decline must have affected psychological preferences in eighteenth-century Holland. The clear association between economic decline and scientific decline confirms this idea. Note that a similar phenomenon occurred in Italy and Belgium (high but decreasing income in the sixteenth and seventeenth centuries, accompanied by very low scientific innovation rates).
Such a graph also allows us to tackle the issue of population size (raised by Allard & Marie). At first sight, scientific production appears to be associated with population size because bigger and relatively more affluent countries such as England, Italy, and France provided many of the most famous scientists. Yet, in reality, per capita analyses reveal that bigger countries (Spain, Italy, Russia) are often less productive than smaller ones, such as Holland, Denmark, and Switzerland (not to mention China or India in the same period).
These quantitative analyses also help address the second aspect of the “why not Holland?” question, which is about the timing of the Industrial Revolution. Why not before? Why not in seventeenth-century Holland if seventeenth-century Holland was as rich as eighteenth-century England? These graphs suggest that this question is an artifact of the approach based on verbal labels. If the question becomes “Did seventeenth-century Holland experience the same level of innovation as eighteenth century England?” then, based on our study, the answer is probably “yes.” The reason we have the impression that Holland is a counterexample is that the Industrial Revolution is associated with the steam engine or the spinning jenny. But if we adopt a more quantitative approach and define the Industrial Revolution as the acceleration of technological innovation and economic growth, then seventeenth century stops being a counterexample. In the seventeenth century, there was an acceleration of scientific innovations (in proportion to the level of economic development), and it was higher in more affluent countries.
I acknowledge that science is not technology, and may not be representative of innovativeness. To address this, Benoit de Courson and I leveraged Wikipedia to build a general indicator of innovativeness using all creative professions such as scientist, but also composer, writer, painter, sculptor, and philosopher. Our database includes more than 30,000 people and allowed us to create a “creative domestic product” per capita. This index shows, again, that the most prosperous countries are the more innovative. In fact, there is a strong correlation between GDP per capita and innovativeness in every domain (r = 0.555, p < 0.001).
Such correlations, of course, cannot establish the causal relationship between living standards and innovativeness or rule out many possible confounding factors. For instance, Artige et al. suggested that printing may have played a role in increasing innovativeness and sparking the Scientific Revolution (Eisenstein Reference Eisenstein1980; Febvre & Martin Reference Febvre and Martin1997; Wootton Reference Wootton2015). Interestingly, the increase in scientific productivity indeed coincides with the invention and diffusion of printing in Europe. However, it is worth noting that the asymmetry of growth in scientific productivity in morthern and southern Europe suggests that its role was relatively minor in the Scientific Revolution. Scientific productivity in the less dynamic parts of Europe (Italy, Spain, Portugal, southern France) indeed does not seem to have been boosted by the invention of printing, despite its widespread use (e.g., Venice built its first press in 1469 and had 417 printers in 1500). Similarly, the diffusion of printed books in China from the ninth century onward did not drastically change the course of scientific productivity in China (Xu Reference Xu2017). The same point has been made for the Ottoman Empire (Coşgel et al. Reference Coşgel, Miceli and Rubin2012). These divergence points may suggest that printing is perhaps not an exogenous invention but rather an endogenous output of a particular society. Specifically, variations in printing usage suggest that printing increases scientific production only in places where people are already innovative.
R1.2. More data on the origins of the variability of economic development
In the target article, I discuss in detail the consequences of the affluence of England on the psychological preference of the English people. However, as pointed out by Seabright; Tainter & Taylor; and Tasic & Buturovic, I do not discuss the origins of England's higher level of affluence. Although I agree that this question is fascinating, it is beyond the scope of the article, which tackles the Great Enrichment (the acceleration of innovation) rather than the Great Divergence. Many works have already shown how early geographical advantages accumulate over the long run and can ultimately explain the divergent growth rates of modern nations (Abramson & Boix Reference Abramson and Boix2014; Chanda & Putterman Reference Chanda and Putterman2007; Comin et al. Reference Comin, Easterly and Gong2010; Diamond Reference Diamond2011; Easterly & Levine Reference Easterly and Levine2003; Olsson & Hibbs Reference Olsson and Hibbs2005). In a recent paper, for example, Henderson et al. (Reference Henderson, Squires, Storeygard and Weil2017) showed that nearly half of the variation in economic activity today can be explained by a parsimonious set of physical geography attributes (prevalence of malaria, ruggedness, temperature, precipitation, length of growing period, elevation, latitude, access to water transport, etc.).
It is important, however, to point out that these works focus mainly on explaining the overall advantage of Eurasia rather than the particular case of northwestern Europe. However, as I alluded to in the target article, some studies have pointed out that northwestern Europe might also have benefited from a number of geographical advantages during the late medieval and early modern periods: suitability for the use of the heavy plow (Andersen et al. Reference Andersen, Jensen and Skovsgaard2016), suitability for the cultivation of the potato (Nunn & Qian Reference Nunn and Qian2011), or a better response to climate change (Pei et al. Reference Pei, Zhang, Lee and Li2016). But more work is needed obviously.
R1.3. More data on living standards
An important part of the article is based on the fact that the most innovative countries, and especially England, were richer during the Industrial Revolution. Several commentators (Artige et al.; Seabright; Stephenson; Tainter & Taylor) expressed their skepticism about England's level of affluence and I fully agree that more data on living standards would be enormously useful to social scientists. Yet, it is worth highlighting that the available data do not contradict the picture presented in this review. Tainter & Taylor rightly point out that it would be problematic for the theory if data revealed that other countries experienced affluence levels comparable to those of eighteenth-century England. But to the best of our knowledge, no indicator (urbanization, GDP, or literacy) suggests that medieval Italy or medieval England experienced a level of development comparable to that of eighteenth-century England. Similarly, we are not aware of any quantitative indicators suggesting that, as Seabright writes, “The French upper classes were probably more affluent than their English counterparts in the sixteenth through eighteenth centuries” (para. 7) (but I shall return to the question of France's living standards in sect. R2.5, for although the French upper class was probably poorer than the English upper class, lower inequality levels may have made the French lower class better off than their English counterpart).
In the same way, Artige et al. raise the very interesting question of China, which I only briefly discuss in the target article (para. 5): “Why did the Industrial Revolution occur in eighteenth-century England, and not earlier in Song China or Renaissance Italy?” Marco Polo indeed provided vivid reports about the wealth of Song China, and these testimonies have had a lasting impact on our collective representation of medieval China. As rich as these testimonies are, however, recent quantitative findings suggest that by 1300, urbanization and GDP per capita in Europe and China were already on par (Bosker et al. Reference Bosker, Buringh and van Zanden2013; Broadberry et al. Reference Broadberry, Guan and Li2018; Xu et al. Reference Xu, van Leeuwen and van Zanden2015). In 1500, Europe was producing 1113 books per inhabitant, whereas China's production per capita was only 19 (Baten & Van Zanden Reference Baten and Van Zanden2008; Xu Reference Xu2017), and other indicators such as the number of book titles per capita also suggest that China was lagging behind Europe as soon as 1200 (Chaney Reference Chaney2018). Obviously, quantitative indicators are scarce before 1800. However, most of them point toward a higher level of development in the West, from the size of the largest libraries (Huff Reference Huff2017, p. 320), to the monetization of the economy (Scheidel Reference Scheidel and Harris2008), to the average duration of rulers (Chaney Reference Chaney2018), or to the development of useful knowledge (Cohen Reference Cohen2012; Deng Reference Deng2010; Huff Reference Huff2017; Mokyr Reference Mokyr2016). On the other hand, it must be noted that China has been ahead of most non-European countries in terms of human development since the nineteenth century. Contrary to Tasic & Buturovic, its current level of economic growth (compared with other middle-income countries) is thus not surprising. What was surprising is rather the long communist stagnation.
Seabright suspects that I am cherrypicking the data on violence and literacy and that “if cathedral building had appeared to favor the Baumard hypothesis, it would have been cited, but because it does not, it was not” (para. 5). No one can of course can claim to have a fully exhaustive take on the wealth of available literature and data, but all the evidence I reviewed on living standards during the eighteenth century is reported in the target article, and although I am aware of fascinating archeological data quantifying ancient Roman and Greek living standards using shipwrecks, water-lifting devices, fish-salting vat capacity, building inscription, and size of churches (Bowman & Wilson Reference Bowman and Wilson2009; Jongman Reference Jongman2014; Morris Reference Morris2013), similar data seem harder to find for the medieval period (although see Blaydes and Paik [Reference Blaydes and Paik2016] for the study of cathedral building and economic performance in twelfth-century Europe). Like Seabright and many other social scientists, I would be keen to have access to similar quantitative indicators for the early modern period (see, e.g., Van Bavel et al. Reference Van Bavel, Buringh and Dijkman2018 on the use of mills, cranes, and other immovable capital goods to quantify economic activity during the medieval period).
To sum up, the extant available data are coherent with the picture described in the target article. I do, however, share the commentators’ excitement to have access to additional data. Specifically, more data are needed if we want to test further the causal relationship between living standards and life history strategies (see sect. R3.3). One way to complement economic proxies, for example, would be to study well-being and happiness. As Huntsinger & Raoul note, “People are generally happier when their basic material needs are met” (Diener Reference Diener2012)” (para. 1). Moreover, “Citizens of richer countries, for example, experience greater subjective well-being and happiness than those of poorer countries. Looking within countries this research reveals that richer citizens are happier than poorer citizens (Sacks et al. Reference Sacks, Stevenson and Wolfers2010)” (para. 2). More critically, perhaps, is longitudinal research showing that as living conditions (e.g., economic and income growth) improve within a country, subjective well-being of its citizens also improves (Sacks et al. Reference Sacks, Stevenson and Wolfers2010; Veenhoven & Vergunst Reference Veenhoven and Vergunst2014).”
It will probably be difficult to quantify happiness throughout history, but some existing studies have put forward interesting attempts. For example, Oishi et al. (Reference Oishi, Graham, Kesebir and Galinha2013) coded State of the Union addresses given by U.S. presidents from 1790 to 2010 and showed that happiness evolved from being presented as good luck and favorable external conditions to being presented as favorable internal feeling states.
R1.4. More data on psychological preferences
Although historians of mentalities and emotions have long documented massive changes in psychological preferences regarding children (Aries Reference Aries1965), love (Duby Reference Duby1988), or violence (Elias Reference Elias1982), quantitative series are scarce if not nonexistent, so the quest for quantitative indicators in this research area is of great importance (Allen; Cowles & Kreiner; Haushofer; Huntsinger & Raoul; Olivola, Moata, & Preis [Olivola et al.]; Stephenson).
In their commentary, Olivola et al. rightly point out that there are now innovative ways to track the evolution of psychological preferences. Specifically, “researchers can now use search engine data to map human behaviors and derive proxies of human cognition at the aggregate level” (para. 1). They take the example of time perspectives (specifically, they used Google Trends to calculate the relative volume of searches for future years, e.g., searching for “2020” in the year 2019), past years (e.g., searching for “2018” in the year 2019), and present years (e.g., searching for “2019” in 2019), within each country. Interestingly, they note that, in line with the Life History Theory approach, these time perspective indices are strongly correlated with per capita GDP (pc-GDP). Surprisingly, however, Olivola et al. find that richer people are more likely to search both for future years and for past years. This seemingly counterintuitive result may be the consequence of poor ecological validity (or of the fact that the slow end of the continuum is associated both with increased future orientation and with increased inward looking and curiosity, irrespective of time).
To take another example, cultural evolution studies in literature have revealed a decline in the proportion of positive emotion-related words over the last two centuries (Morin & Acerbi Reference Morin and Acerbi2017). If one assumes that well-being and happiness are correlated and that better living standards increase well-being, the decrease in positive-related words in literary fiction raises a contradiction that has yet to be resolved. A similar remark can be made about the “optimistic language” built by Varnum and Grossmann. I agree with them that optimism is characteristics of a slow life history, but whether or not we are adequately capturing optimism when counting optimistic words is not fully clear.
One way to tackle this difficulty would be to use more ecologically valid indicators. With Lou Safra, Coralie Chevallier, and Julie Grèzes we have sought to apply novel methods to extract quantitative information from social cues in portraits, which are particularly promising cultural artifacts to document and quantify the level of trust over time (Safra et al. Reference Safra, Grèzes, Chevallier and Baumard2019). Experimental works have indeed revealed that specific facial features, such as a smiling mouth or wider eyes, are consistently recognized as cues of trustworthiness across individuals and cultures (Bente et al. Reference Bente, Dratsch, Kaspar, Häßler, Bungard and Al-Issa2014; Birkás et al. Reference Birkás, Dzhelyova, Lábadi, Bereczkei and Perrett2014; Engell et al. Reference Engell, Haxby and Todorov2007; Todorov et al. Reference Todorov, Olivola, Dotsch and Mende-Siedlecki2015; Walker et al. Reference Walker, Jiang, Vetter and Sczesny2011; Xu et al. Reference Xu, Wu, Toriyama, Ma, Itakura and Lee2012). We capitalize on this large empirical literature to build an algorithm that estimates trustworthiness based on a pre-identified set of facial characteristics (Sofer et al. Reference Sofer, Dotsch, Oikawa, Oikawa, Wigboldus and Todorov2017). Our results indicate that trustworthiness in portraits increased over the period 1500–2000, paralleling the decline of interpersonal violence and the rise of democratic values observed in Western Europe. Time-lag analyses further reveal that the increase in living standards predates, rather than follows, the increase in trustworthiness displays.
R2. More models are needed
R2.1. The role of resources (rather than mortality) in Life History Theory
Several commentators (Blute; Tasic & Butruvic; Woodley of Menie, Figueredo, Aurelio & Sarraf [Woodley of Menie et al.]) discussed the relationship between Life History Theory and cultural evolution. One important point, noted by Blute, is that Life History Theory must be distinguished from the r/K theory, which focuses mostly on density-dependent selection. Another important point is that standard Life History Theory aims to explain patterns of growth and reproduction in terms of fitness maximization in a given ecological context (Promislow & Harvey Reference Promislow and Harvey1990; Stearns Reference Stearns1992). This body of work has focused on the effect of age-specific mortality and has inspired a lot of research in human behavioral literature (Nettle Reference Nettle2009b).
By contrast, this article departs from this tradition in the sense that it does not posit that mortality rate is the crucial factor accounting for behavioral differences within the human species. First, mortality did not change very much before the advent of scientific medicine in the early twentieth century. Second, and more importantly, even large changes in mortality are unlikely to explain the kind of behavioral variations described in the target article.
Consider, for instance, Bateson et al.’s (Reference Bateson, Brilot, Gillespie, Monaghan and Nettle2015) study of impulsive decision making in starlings: Birds showing greater telomere attrition (an integrative marker of a poor biological state) were found to favor sooner-smaller rewards (one pellet of food in 1 second) more than larger-later ones (five pellets in x seconds). An interpretation of these results based on differential mortality risks would be as follows: Starlings in a poorer biological state have a greater probability of dying before collecting delayed rewards and should therefore favor short-term benefits. However, this interpretation is unlikely because dying during a choice experiment that does not exceed a few minutes is an extremely unlikely event, even for birds in poor states (Mell et al. Reference Mell, Baumard and André2017a). As in the starling example above, average differences in mortality (in years) are unlikely to account for specific discount rates when rewards are delayed over short periods (e.g., weeks, months, or even a few years).
This point is well illustrated by Riis-Vestergaard and Haushofer (Reference Riis-Vestergaard and Haushofer2017) in their response to Pepper and Nettle's paper on the Behavioral Constellation of Poverty:
People discount 46% over one year in Wang et al. (Reference Wang, Reiger and Hens2016) – that is, they are indifferent between receiving a payment of $x one year from today and $x * 0.46 today, which translates into a required interest rate of more than 116%. However, average mortality risk over one year in the countries in this dataset is only 0.148%; thus, if the risk of dying before a future payment were realized were the only factor influencing discounting, people would be indifferent between receiving $x in one year and $x ∗ 1/(1 + 0.00148) = $x ∗ 0.999 today. Mortality risk can therefore only account for 0.13% of the observed discounting. To produce discounting on the order of magnitude observed in the data, people would have to misestimate the prevailing mortality risk by a factor of 769. Thus, even if mortality rates partially explain the behavioral constellation of deprivation, it seems unlikely that it is the most important explanatory factor. (Riis-Vestergaard & Haushofer Reference Riis-Vestergaard and Haushofer2017, pp. 39–40)
In the target article, I thus rather focus on the effect of resources on life history strategies. To date, few formal treatments have been proposed to integrate the effect of resources in Life History Theory approaches (but see Mell Reference Mell2018; Mell et al. Reference Mell, Baumard and André2017a). But the basic mechanism is very intuitive and is related to the pyramid of needs (Kenrick et al. Reference Kenrick, Griskevicius, Neuberg and Schaller2010; Maslow Reference Maslow1943). The idea is that not all somatic investments have the same return rate and that the return rate of each investment depends on the somatic state of the individual and his or her stage of development. For an individual in a poor somatic state, investing in repairing the body is the most profitable investment. By contrast, for an individual in a good somatic state, investing in learning (rather than boosting the immune system one more time) is the most profitable investment. Thus, depending on where an individual is in the pyramid on needs, he or she will not have the same behavioral strategy. A range of studies indeed confirm that resources alone can explain massive behavioral difference between individuals, between social classes, and between societies (Inglehart Reference Inglehart2018; Jacquet et al. Reference Jacquet, Safra, Wyart, Baumard and Chevallier2019; Mell et al. Reference Mell, Safra, Baumard and Jacquet2017b; Safra et al. Reference Safra, Algan, Tecu, Grèzes, Baumard and Chevallier2017)
R2.2. Life History Theory and innovativeness
In the target article, I defended the idea that higher levels of resources should increase innovativeness. Although they agree with this prediction, several commentators (Boudesseul & Rubiños; Greenbaum, Fogarty, Colleran, Berger-Tal, Kolodny, & Creanza [Greenbaum et al.]; Woodley of Menie et al.) put forward the idea that increased harshness should also increase innovativeness. Using optimal foraging theory, Greenbaum et al. contend that “risk-taking, explorative, and innovative behaviors are to be expected in stressed and subordinate individuals with less access to resources, because it is those individuals that must be creative to increase their fitness” (para. 2).
I agree that this is possible and very compatible with the theory put forward in the target article, especially because, as Greenbaum et al. point out, increased harshness and increased affluence “should be expected to correlate with different types of innovations” (para. 2), a point also raised by Woodley of Menie et al. but with a different perspective. Specifically, harshness should lead to “goal-oriented, short-time-scale problem-solving behavior, which involves modest risks and payoffs that can be clearly stated or conceptualized” (Greenbaum et al., para. 3), whereas affluence should lead to “creative behavior that is directed toward more open-ended problems, where the payoffs are more abstract, and not easily defined a priori” (Greenbaum et al., para. 3), that is, the kind of macro-innovations typical of the Industrial Revolution.
R2.3. Which proximate mechanism was involved in the Industrial Revolution: Optimism, happiness, trust, or intelligence?
In the target article, I listed several psychological changes that might have played a role in the Industrial Revolution: time discounting, optimism, intrinsic motivation, and trust. Van der linden & Borsboom add to this list that increased intelligence may also have played a role because a large empirical literature has found “a robust association between affluence and cognitive ability, which is likely to be at least partly causal in nature.” As they note, this is totally compatible with the Life History Theory approach because a slower strategy is associated with higher somatic investment. I totally agree with them. An increase in intelligence may not explain the whole constellation of affluence (e.g., increase in trust, optimism, romantic love), but it is undeniable that it must have played a role in the rise of innovativeness and that I should have included it in the target article. In the same way, Huntsinger & Raoul put forward the idea that happiness and well-being may have played a role in the explosion of innovation because higher happiness is associated with higher creativity. From an evolutionary perspective, the function of happiness and subjective well-being is to “signal progress toward adaptive goals” (Kenrick & Krems Reference Kenrick, Krems, Diener, Oishi and Tay2018). More work is thus needed to identify the range of proximate mechanisms involved in increased innovativeness.
R2.4. The behavioral constellation of affluence and its role in cultural evolution
As emphasized in the target article, innovation is only one aspect of a larger “behavioral constellation of affluence.” Increased access to resources has many effects on human psychology. Historically, the increase of resources is thus likely to explain not only the Industrial Revolution, but also the Age of the Enlightenment, the Scientific Revolution, the decline of violence, the decline of religion, the rise of democracy, and the demographic transition (about this last point, see also sect. R2.5). Hewson add to this list the rise of the bureaucratic state (what Douglas Allen [Reference Allen2011] has called the “Institutional Revolution”), noting that “an effective state depends above all on the cooperativeness of the elite, willing to put aside factional interests, willing also to exercise restraint in not dominating the non-elite” (para. 7). Hewson also adds to this list the European Marriage Pattern (nuclear family, late marriage), a late medieval phenomenon that “requires some degree of slow life history because it means deferring marriage and investing in cooperating with non-kin, which has a less immediate but better long-term pay-off than cooperation with kin” (para. 5).
Thus, there is (if the reader grants me one more constellation) a “behavioral constellation of modernity.” This is, I believe, one of the strengths of the Life History approach. As Hewson writes: “These indications point to life history theory as a relatively parsimonious way to reconcile several bodies of evidence and lines of explanation into a coherent general account of the roots of economic modernity – a great reconciliation about the great enrichment” (para. 1). In fact, social surveys on modern populations show that there is a cluster of modern values: democracy, tolerance, secularization, social justice, et cetera. (Inglehart Reference Inglehart2018).
The multiple aspects of the “behavioral constellation of modernity” have far-reaching consequences for our understanding of cultural evolution (Baumard Reference Baumard2017). Cultural norms (e.g., feudalism, Christianity, courtly ethos) are often presented as the ultimate triggers of the rise of modernity but they could very well be the consequence of a general change in people's psychology. Consider, for instance, North's famous thesis that the rise of the West was caused by institutional changes and a better protection of property rights, which are themselves presented as the product of some lucky circumstances (Acemoglu & Robinson Reference Acemoglu and Robinson2012). However, as Artige et al. rightly point out, institutional changes might well be the product of rising affluence. (A very similar point can be made about Atran’s proposal that England had an especially liberal culture.) If resources can trigger changes in individuals’ psychology and ultimately changes in values such as authoritarianism, trust, and optimism, then any cultural change can in principle be explained as the result of a psychological change or “evoked culture” (Tooby & Cosmides Reference Tooby, Cosmides, Barkow, Tooby, Cosmides, Barkow, Tooby and Cosmides1995).
In the same way, Dutra proposes that “cultural interconnectedness and in-group cooperation” may be at the origin of changes in the psychology of English people and of their innovative behavior. But, again, “cultural interconnectedness and in-group cooperation” could well be the product (rather than the cause) of affluence. Dutra explains England's higher cultural interconnectedness by its history of exploration, commercial expansion, and military colonialism (a related point also discussed by Cowles & Kreiner, as well as Luoto, Rantala, & Krams (Luoto et al.). However, as Tasic & Buturovic note, “LHT may be able to explain the settling of America, as the settlers exhibited precisely the initiative, optimism, and long-term horizon that Baumard argues was crucial for the enrichment of England” (para. 2). (In addition, not all maritime nations were ultimately successful, as the examples of Portugal, Spain, or even France attest). Of course, more work needs to be done to disentangle the various causal channels behind the rise of innovativeness (see sect. R3), but it is important to keep in mind that cultural values should not be considered as ultimate causes.
At this point, skeptics may wonder whether everything can be considered a part of the “behavioral constellation of affluence.” In response to this, it is important to emphasize that the constellation has clear boundaries, and each of its elements has a predictable direction: more cooperation, not less; more exploration, not less; more patience, not less. Did England (and Europe) fit this description? In their commentary Cowles and Kreiner point out that England, and Europe in general, displayed very high levels of violence during the early modern period (a point also noted by Dutra and Atran). This, as well as the religious wars and the rise of absolutism, does not fit the constellation. And indeed, in absolute terms, it is undeniable that early modern Europe was violent, intolerant, racist, and sexist. But the more interesting question is relative: Was early modern Europe (or England) more violent, intolerant, racist, and sexist relative to other pre-industrial societies? Do we have evidence that a psychological shift was operating and that people in the Middle Ages had a more tolerant psychology relative to their predecessors? Framed as such, the answer to the question is straightforward: Early modern Europe abolished slavery for the first time in history, religious tolerance increased, and democracy rose. In fact, even the “crusading ethics” brandished by Cowles and Kreiner needs to be considered in the context of medieval history. Unlike many wars in history, the Crusades were partly triggered by moral considerations (taking back the Holy Land) rather than by pure material or political considerations (although, of course, there were undeniable material and political considerations). One piece of clear evidence of the moral aspect of the Crusades is that many crusaders started the Crusades by giving away their wealth and by making penance for they thought that being morally clean would further their success in the Crusades (Blaydes & Paik Reference Blaydes and Paik2016; Vauchez Reference Vauchez1993). Moreover, thousands of middle- and lower-class people, including women and children, chose to join the movement and to sacrifice their well-being for what (they thought) was a noble cause. But the best response to Cowles and Kreiner is probably quantitative studies of violence showing a strong decrease in interpersonal violence from at least the late medieval period onward (Pinker Reference Pinker2011a; Reference Pinker2018). This illustrates the need for a quantitative approach in history, a point discussed in section R1.
R2.5. Which ultimate environmental changes triggered the Industrial Revolution: Increased affluence, increased material safety, or decreased inequality?
The target article reviews the broad correlation between higher living standards and higher innovativeness. But as Chen & Han note, “two fundamental dimensions of environmental risk have been identified as affecting life history outcomes: harshness and unpredictability” (para. 2). Harshness refers to the absolute level of resources, whereas unpredictability refers to the variability in the availability of resources. Thus, the correlation between higher living standards and higher innovativeness might be explained in two (not mutually incompatible) ways. First, richer people may be more innovative because they have more resources, money, or time to invest in exploration. Second, richer people may be more innovative because their higher level of resources makes their environment more predictable: They do not need to worry about tomorrow and they can afford to take more risks. Empirical studies have often focused on harshness, which is easier to measure, but it is possible that unpredictability has larger effects than absolute harshness (Jacquet et al. Reference Jacquet, Safra, Wyart, Baumard and Chevallier2019).
The effect of unpredictability might explain the marginal role played by The Netherlands in the Industrial Revolution (and its massive decline in scientific innovativeness in Fig. R2, sect. R2.1). As Allen notes, “The Netherlands was the richest economy of the day, but the Industrial Revolution passed it by” (para. 8). However, as discussed in section R1, The Netherlands experienced an important recession during the eighteenth century. In other words, despite their high level of income, Dutch people lived in a very uncertain environment during this century. This could explain why they became much less innovative in the eighteenth century than the in seventeenth century. From an evolutionary and psychological points of view, being rich in a volatile (or, worse, in a declining) environment is different from being rich in a stable (or rising) environment, which also fits with Chen and Han's commentary: Unpredictability seems to have important negative effects on innovativeness.
It is also worth noting that the effect of unpredictability is probably more important for lower-income social classes. Thus, the importance of environmental unpredictability for understanding the Industrial Revolution depends on which social class contributed most to the process of technological innovation. If technological innovation was the product of upper-class and upper-middle-class inventors, the so-called “upper-tail of human capital,” then the role of affluence might have been more important than that of unpredictability. However, if innovation was the product of the “artisans and apprentices who tinkered” (Stephenson), then the role of unpredictability might have been more important.
How can we decide between these two scenarios? One possibility is to look at inequalities: All things being equal, the more unequal the society, the poorer the poor and the richer the rich. If what matters is the income of the upper class (the inventors), then inequality should not prevent the rise of innovativeness. On the contrary, if what matters is the basic income of all social classes (including the tinkerers), then inequality should hinder the rise of innovativeness. This comparison converges with many commentaries (Artige et al.; Chen & Han; Seabright; Stephenson) inquiring about the impact of inequality (rather than poverty) in explaining life history strategies: “Did their relative wealth matter? How does inequality impact on reward orientation, materialism, and cooperation? If innovators arose only in a particular class or group, then is the greater wealth of England necessary for the theory to hold?” (Stephenson, para. 3).
Data on inequalities are scarce (which is partly the reason I did not discuss this point in the target article). Yet, existing works all point toward a rise of inequalities in Western Europe during the early modern period (Alfani Reference Alfani2015; Alfani & Ammannati Reference Alfani and Ammannati2017; Alfani & Ryckbosch Reference Alfani and Ryckbosch2016). This could suggest that the income level of the upper class, rather than the income level of the whole population, was the driving factor. However, it should be noted that inequality is not synonymous with poverty: England could have been more unequal but because it is was also richer, the English lower class might still have been richer than lower classes in the rest of Europe.
Another possibility is to look at other cultural revolutions. Historians have long noticed that while England was pioneer in terms of technological innovation, France was a pioneer in the political and demographic domains, with the French Revolution and the decrease in childbirth (a point noted by Hewson). Just as the Industrial Revolution started in England and then spread to the rest of the world (starting first with the most developed countries), the democratic and the demographic revolutions started in France and spread to the rest of the world, starting again in the most developed countries.
The fact that France, a country that was less affluent than England, was nonetheless ahead of England politically and demographically has long puzzled historians and represents a genuine problem from an evolutionarily grounded theory of cultural change. From an evolutionary perspective indeed, the shift from high to low fertility should have first occurred in the most affluent country. In a recent article, Cummins (Reference Cummins2013) argued that this can be explained by France's higher level of equality. At the aggregated level, England was indeed richer, but at the individual level, it is possible that the lower class was richer in France than in England. This possibility fits well with Stephenson’s recent research indicating that unskilled men in London may have been half as rich as what previous estimates suggested and that (as noted by Seabright) England was no better than poorer countries such as Germany and the Scandinavian nations in terms of average literacy.
What made France more equal in the modern period? First, serfdom had long disappeared by the eighteenth century, and most peasants owned some land, unlike in most other countries in Europe. Second, compared with England, the proportion of landowners was much higher in France than in England, even before the French Revolution (a point noted by Atran) (Chesnais Reference Chesnais1992; Cummins Reference Cummins2013). Third, inequality kept decreasing in France in the nineteenth century (Morrisson & Snyder Reference Morrisson and Snyder2000) as a result of the abolishment of feudal rights and the abolishment of the dime (a tax that “disproportionately” affected the lower classes), the rise of urban wages, and most importantly the confiscation and selling of church properties. In 1830, roughly 63% of the population was represented by landowners and their families, whereas the comparable figure for Britain is 14% (Chesnais Reference Chesnais1992; see also Piketty et al. Reference Piketty, Postel-Vinay and Rosenthal2006).
Studying fertility life histories and wealth at death in four rural villages in France during the period 1750–1850, Cummins (Reference Cummins2013) first shows that wealthy household actually reduced their fertility first, in line with evolutionary theory. He then shows that where fertility is declining, economic inequality is lower than where fertility is high, which confirms the idea that France started the demographic transition because lower-class people were better off than in other countries. A recent study, again at the micro-level, complements the idea that the demographic transition was indeed led by better economic conditions. Using a unique, comprehensive household-level data set for a single French village from 1730 to 1895, Blanc and Wacziarg (Reference Blanc and Wacziarg2019) found that the rise of life expectancy (in the middle eighteenth century) preceded the fall of fertility by several decades, confirming the idea that the French demographic transition was led by an increase in living standards (Béaur Reference Béaur2017).
To sum up, these preliminary works raise the intriguing possibility that depending on the income distribution, increased affluence may produce different cultural changes: What would matter for the Industrial Revolution would be the living standards of the upper class, whereas what matters for the demographic, and (possibly) for the democratic, transition, would be everyone's living standards, including those of the lower classes. We probably need better models to understand why the effects of living standards vary across cultural domains (on the specific role of capital in cultural evolution, see André & Baumard Reference André and Baumard2019).
R3. More predictions and more statistical instruments
As Seabright noted, we are not short of theories on the Industrial Revolution. What we need is better predictions and better instruments to decide between these theories. In this section, I discuss in more details the difference between the Life History Theory approach and two alternatives: genetic selection (sect. R3.1) and rational choice (sect. R3.2). I then argue, in agreement with Haushofer, that natural experiments would be especially needed to decide between competing theories (sect. R3.3).
R3.1. Genetic selection or adaptive plasticity?
Several commentators (Luoto et al., Woodley of Menie et al.) have pointed out that genetic selection may explain the rise of the psychology of affluence. (Tasic & Buturovic seem to think that the Life History approach implies an episode of genetic selection in the eighteenth century. It does not.) As noted at the end of the target article, it is indeed quite likely that, since at least the Neolithic, psychological traits such as time discounting, cognitive exploration, cooperation, and IQ have been under selection. Thus, the question is not whether some genes related to innovation were under selection during the early modern period, but whether, as it has been proposed by Gregory Clark and by the proponents of the Unified Growth Theory, this episode of selection was strong enough to account for the increase in innovation.
It is hard to decide between genetic selection and adaptive plasticity because, at the behavioral level, they make essentially the same predictions: Individuals should have higher levels of exploration, cooperation, and long-term thinking in more affluent and more developed societies. The main difference probably concerns the rate of evolution. In particular, according to the Life History Theory approach, one or two generations might be enough to trigger the “psychology of affluence.” This is essentially what the work of Ronald Ingelhart and his colleagues shows (Inglehart Reference Inglehart2018; Inglehart & Welzel Reference Inglehart and Welzel2005): Using international surveys from the 1970s, they demonstrate that, with rising living standards, each generation is psychologically slower then the earlier generation, and that the differences between successive generations are massive, and may account for sudden cultural changes such as the 1968 protests and the rise of gay and women's rights. In his commentary, Hewson points that out oil-exporting countries seem to be a counterexample: despite their very high income, they are still very conservative. This is true indeed. Yet, international surveys show that the opinion of the younger generation, the one actually born in an affluent country, differs from that of older generations (Inglehart Reference Inglehart2018), but because these countries are not democratic, these psychological changes may have remained hidden (Bursztyn et al. Reference Bursztyn, González and Yanagizawa-Drott2018)
Whatever the role of genetic selection, it is unlikely that very general factors such as climate and coldness explain why the Industrial Revolution occurred at a particular place and at a particular time. As Luoto et al. acknowledge, explaining the specific tide of events that led to the Industrial Revolution, climate is not specific enough to account for the timing and the location of the Industrial Revolution (on the limit of climatic explanation, see also Currie & Mace Reference Currie and Mace2012; Mell et al. Reference Mell, Safra, Baumard and Jacquet2017b; Thornhill & Fincher Reference Thornhill and Fincher2013).
R3.2. Rational choice or adaptive plasticity?
The other important alternative to adaptive plasticity is rational choice theory. As many commentators (Allard & Marie; Allen; Haushofer; Hirshleifer & Teoh; Seabright) pointed out, the evidence offered in the target article is perfectly compatible with rational choice theory. As Hirshleifer & Teoh write:
The evidence and arguments that Baumard brings to bear in support of this explanation for the Industrial Revolution do not uniquely distinguish it from plausible alternatives. A very simple one is that increased prosperity freed up more time for individuals to engage in innovative activity and increased the benefits from doing so. This possibility is consistent with the great bulk of the evidence adduced in support of the preference-shift explanation. (para. 1)
Some commentators (Allen; Haushofer; Hirshleifer & Teoh; Seabright) also point out that rational choice is more parsimonious than evolved plasticity as it required only the ability to respond to changes in costs and benefits (rather than the capacity to change psychological priorities).
I fully agree that these criticisms are warranted and tried to anticipate them in the target article (sect. 6.3) using two main arguments: (1) Life History Theory provides a better account of the “behavioral constellation of affluence,” which is increased not only in innovativeness, but also in the rise of trust, romantic love, or empathy. (2) Life History Theory explains the rigidity of human psychology better, that is, the fact that some preferences are calibrated in utero or during childhood and does not seem to respond to changing costs and benefits later in life.
Hirshleifer & Teoh concede that Life History Theory explains the other parts of the constellation well. Yet, these behavioral changes may have played a relatively minor role in the Industrial Revolution. Furthermore, these changes could also result from pure rational reasons:
For example, consider the shift of the English novel toward a focus on long-term planning. The only difference in our possible explanation for this shift from Baumard's is that this shift, instead of deriving from a shift in people's personalities, could derive from an incentive-induced shift in people's interest and attention toward long-term strategies. (para. 8)
As for the second argument (early calibration and rigidity), Hirshleifer & Teoh suggest that one way to tease apart the two theories would be to develop evidence about age-specific environmental shifts and their effects. Here, I think that the Life History approach is on better grounds because the work of Inglehart and his collaborators (Inglehart Reference Inglehart2018; Inglehart & Welzel Reference Inglehart and Welzel2005) clearly show cohort effects: People living in the same country at the same time have different opinions depending on the year they were born in. Furthermore, people display a high level of rigidity: International surveys show that people's level of post-materialism does not evolve very much over their life course, despite a huge change in the environment (in particular in income level). Further works have shown long-lasting effects of traumatic (and exogeneous) events (Hörl et al. Reference Hörl, Kesternich, Smith and Winter2016).
Finally, it might be worth considering other cultural revolutions such as the demographic transition (see sect. R2.4). Unified Growth Theory, for example, explains the demographic transition as a response to industrialization and the increasing return of human capital (Galor Reference Galor2011). The rising incentives to accumulate human capital modify the trade-off between the quantity and quality of children. Families respond (rationally) to these changes by reducing their number of children and by investing more in their education. By contrast, Life History Theory explains the demographic transition as phenotypic change in individual's strategy, triggered by the fall of mortality: Because children are less likely to die, individuals reduce their fertility and invest more in each child.
In their work on the French demographic transition, Blanc and Wacziarg (Reference Blanc and Wacziarg2019) found that the fall of fertility preceded the rise in education by several decades and did occur in the absence of industrialization (e.g., in the four villages studied, the share of the adult male population engaged in agriculture remained stable, at 67% from 1780 to 1800 and 69% from 1875 to 1895, and the small textile weaving industry declined from 11% to 5% of the adult male population during the same period). This suggests that, against Unified Growth Theory, the fall of fertility occurred in the absence of any change in the return of human capital. By contrast, the fall of fertility was preceded by the rise of life expectancy (in the middle eighteenth century), which corresponds to the prediction of the Life History Theory framework.
Beyond the case of the demographic transition, this debate illustrates the difference between rational choice theory and evolutionary theory: For the former, individuals respond to incentives in the environment, whereas for the latter, evolved mechanisms (that are not necessarily adapted to the current environment) respond to specific cues that were, on average, relevant in the environment of evolutionary adaptedness. Even if it is currently difficult to tease apart the predictions of the two frameworks, it is likely that ultimately, they will generate a range of diverging predictions.
R3.3. More natural experiments
Many commentators have pointed out the need to tease out causal effects from historical data (Artige et al.; Dutra; Haushofer; Hewson; Kotchoubey; Seabright; Tasic & Buturovic; Varnum & Grossmann), and I could not agree more. As shown by Varnum & Grossmann’s commentary, it is extremely difficult to statistically tease apart the direction of causality and the exact causal role of each factor. This is especially true for the Life History Theory framework because it predicts a cluster of psychological traits (see sect. R1.2). As Kotchoubey notes, “there is a uniform relation between affluence, innovation rate, quality of life, prosocial behavior, optimism, long-term investments (e.g., education), social trust, and several other variables, all being negatively correlated with violence and materialist views” (para. 1).
In response to this problem, the tradition in behavioral and brain sciences has been to build large, complex models that observe and model all confounders and to use methods such as Granger causality, Structural Equation Modelling, and Bayesian networks. All these methods assume that confounding is unlikely or impossible. Yet, as Marinescu et al. (Reference Marinescu, Lawlor and Kording2018) point out in a recent review paper, “unconfoundedness is rarely plausible as virtually all systems that we study have more variables of importance than we can realistically measure or model.” The alternative is, as Haushofer suggests, using causal or quasi-causal methods and, in particular, natural experiments, such as Nunn & Wantchekon's (Reference Nunn and Qian2011) famous paper on the impact of slavery on trust in Africa. The idea is to find variables in data sets that are assigned in a way that is as good as random and to use methods such as Regression Discontinuity Design, Difference-in-Differences approach, and Instrumental Variables. As Marinescu et al. note, these techniques are standard in economics yet are rarely used in many branches of behavioral and neuroscience research.
In the section entitled “Testing the Theory” (sect. 6.3) in the target article, I mention a working paper in collaboration with economists Elise Huillery and Leo Zabrocki, in which we use the introduction of the heavy plow as a causal instrument and exploit two sources of exogenous variation: variation over time arising from the adoption of the heavy plow on the one hand, and cross-sectional variation arising from differences in regional suitability for adopting the heavy plow on the other hand. We show that an exogenous income shock can explain the increase of some psychological preferences such as romantic attachment and attitudes regarding self-control (Baumard et al. Reference Baumard, Huillery and Zabrocki2018). Of course, our work does not deal with innovativeness in the early modern period, but it does provide an interesting example of the way in which predictions of the Life History Theory framework can be causally tested in history. Future work should aim to find natural experiments to test the causal role of affluence in explaining the rise of innovativeness in early modern England.



Target article
Psychological origins of the Industrial Revolution
Related commentaries (24)
A claim for cognitive history
A needed amendment that explains too much and resolves little
Affluence boosted intelligence? How the interaction between cognition and environment may have produced an eighteenth-century Flynn effect during the Industrial Revolution
Are both necessity and opportunity the mothers of innovations?
Cultural interconnectedness and in-group cooperation as sources of innovation
Energy, transport, and consumption in the Industrial Revolution
England first, America second: The ecological predictors of life history and innovation
Environmental unpredictability, economic inequality, and dynamic nature of life history before, during, and after the Industrial Revolution
Explaining historical change in terms of LHT: A pluralistic causal framework is needed
Interrelationships of factors of social development are more complex than Life History Theory predicts
Life History Theory and economic modernity
Life History Theory and the Industrial Revolution
Many causes, not one
Psychological origins of the Industrial Revolution: Why we need causal methods and historians
Psychology and the economics of invention
Slowing life history (K) can account for increasing micro-innovation rates and GDP growth, but not macro-innovation rates, which declined following the end of the Industrial Revolution
The affective origins of the Industrial Revolution
The other angle of Maslow's pyramid: How scarce environments trigger low-opportunity-cost innovations
The wealth→life history→innovation account of the Industrial Revolution is largely inconsistent with empirical time series data
There is little evidence that the Industrial Revolution was caused by a preference shift
Timing is everything: Evaluating behavioural causal theories of Britain's industrialisation
Using big data to map the relationship between time perspectives and economic outputs
What came first, the chicken or the egg?
What motivated the Industrial Revolution: England's libertarian culture or affluence per se?
Author response
Psychological origins of the Industrial Revolution: More work is needed!