





No CrossRef data available.
Article contents
Child versus adult probabilities of death and their effects on under-25 and total fertility: a test using over 30 years of panel data from 204 countries and territories
Published online by Cambridge University Press: 11 November 2025
Abstract
After presenting their two-tier model, Ellis, Reid, and Kramer (2024) tentatively state that child mortality risk should predict offspring quantity, while adult mortality risk should accelerate reproductive timing. I test these assertions using mortality risk and fertility data from the Global Burden of Disease (GBD) project for 204 countries and territories over 32 years, finding partial support for their predictions.
Information
- Type
- Open Peer Commentary
- Information
- Copyright
- © The Author(s), 2025. Published by Cambridge University Press
References
Beaujouan, E., Zeman, K., & Nathan, M. (2023). Delayed first births and completed fertility across the 1940–1969 birth cohorts. Demographic Research, 48, 387–420. https://doi.org/10.4054/DemRes.2023.48.15
CrossRefGoogle Scholar
Ellis, B. J., Reid, B. M., & Kramer, K. L. (2024). Two tiers, not one: different sources of extrinsic mortality have opposing effects on life history traits. Behavioral and Brain Sciences, 1–75. https://doi.org/10.1017/S0140525X24001316
CrossRefGoogle Scholar
Global Burden of Disease Collaborative Network. (2021). Global burden of disease study 2021. Institute for Health Metrics and Evaluation (IHME), 2024. https://www.healthdata.org/research-analysis/about-gbd
Google Scholar
Kievit, R. A., Frankenhuis, W. E., Waldorp, L. J., & Borsboom, D. (2013). Simpson’s paradox in psychological science: a practical guide. Frontiers in Psychology, 4, 1–14. https://doi.org/10.3389/fpsyg.2013.00513
CrossRefGoogle ScholarPubMed
R Core Team. (2024). https://www.R-project.org/ [R]. Foundation for Statistical Computing, Vienna, Austria.Google Scholar
Rosenbaum, P. (2020). Does early childbearing matter? new approach using Danish register data. Labour Economics, 65, 101852. https://doi.org/10.1016/j.labeco.2020.101852
CrossRefGoogle Scholar
Roth, G. A., Abate, D., Abate, K. H., Abay, S. M., Abbafati, C., Abbasi, N., Abbastabar, H., Abd-Allah, F., Abdela, J., Abdelalim, A., Abdollahpour, I., Abdulkader, R. S., Abebe, H. T., Abebe, M., Abebe, Z., Abejie, A. N., Abera, S. F., Abil, O. Z., Abraha, H. N., & Murray, C. J. L. (2018). Global, regional, and national age-sex-specific mortality for 282 causes of death in 195 countries and territories, 1980–2017: a systematic analysis for the global burden of disease study 2017. The Lancet, 392(10159), 1736–1788. https://doi.org/10.1016/S0140-6736(18)32203-7
CrossRefGoogle Scholar
Salkeld, D. J., & Antolin, M. F. (2020). Ecological fallacy and aggregated data: a case study of fried chicken restaurants, Obesity and Lyme disease. EcoHealth, 17(1), 4–12. https://doi.org/10.1007/s10393-020-01472-1
CrossRefGoogle Scholar

Table 1. Descriptive statistics for the variables included in the analyses. Averages are for all 204 countries and territories over the 32 years from 1990 to 2001
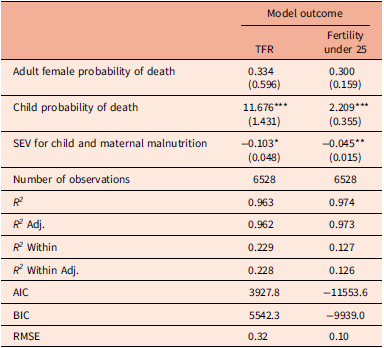
Table 2. Results for panel regressions with robust standard errors from two separate models: the model on the left predicting total fertility rate (TFR) and the model on the right predicting fertility to women under 25 years of age

Figure 1. Time series plots showing changes in key variables over time for the 204 countries and territories.
Target article
Related commentaries (29)
Density slows, while pathogens and disasters accelerate life history within populations
Hierarchical response models: new perspectives on development
The mortality-fertility relationship from the economic demography perspective
 You have
Access
Introduction
In their Behavioral and Brain Sciences target article Two tiers, not one: Different sources of extrinsic mortality have opposing effects on life history traits, Ellis, Reid, and Kramer (Reference Ellis, Reid and Kramer2024) make the case for a two-tier model of factors influencing life history strategies. They argue that energetic resources provide a first tier of environmental influence, serving to slow reproductive development, while ambient cues to extrinsic mortality provide a second tier of environmental influence, which accelerates it. They also emphasize that whether and how cues to child versus adult mortality affect reproductive strategies is a question that requires further investigation:
“Consistent with life history models, child mortality appears to be especially relevant to shifting allocation of resources toward offspring quantity over quality, whereas premature death among prime-age adults appears to play a prominent role in shifting toward current over future reproduction. This distinction should be considered tentative, however, given inconsistencies in the data (Section 2.3; Section 3.1). Further work is needed to more precisely delineate the evolved decision rules that guide different LH responses to ambient cues to EM in relation to child versus adult mortality risks.”
Based on the distinction made in the quote above, we might predict that:
1. Child mortality should be more strongly predictive of total fertility than should adult female mortality.
2. Adult female mortality should be more strongly associated with fertility under 25 than with total fertility.
Methods
Here, I present a test of the above predictions using panel regression models with data from the Global Burden of Disease Project (GBD; Global Burden of Disease Collaborative Network, 2021) for 204 countries and territories for the years from 1990 to 2021. Full details of the GBD methodology are given at https://www.healthdata.org/research-analysis/gbd. The variables included in the analysis are as follows:
Probability of death for children under 5
Child mortality risk will be represented by the probability that a person dies between birth and age 5 if the rates of all-cause mortality in a specified year of interest were to remain constant into the future.
Probability of death for adult females
Adult female mortality will be represented by the probability of death for women between the ages of 10 and 54. This is the age range the GBD project uses as the potential reproductive age range to estimate female fertility.
Child and maternal malnutrition summary exposure variable (SEV)
This is a measure of a population’s exposure to child and maternal malnutrition. It includes the extent of exposure by risk level and the severity of the child and maternal malnutrition’s contribution to disease burden. The GBD SEV values take the value of 0% when no excess risk exists and the value of 100% when the total population is at the highest level of risk. This variable is included in the analyses because a two-tier model approach requires controlling for the effects of energetic constraints before examining any effects of extrinsic mortality risk.
Uncertainty interval weights
GBD project data have 95% uncertainty intervals, which reflect the certainty of each estimate. Here, analyses are weighted by the inverse of the absolute distance between the upper and lower uncertainty intervals for the child and maternal malnutrition SEV, to give greater weight to countries and years with more certain estimates. The child and maternal malnutrition SEV uncertainty interval was chosen as the weighting variable because uncertainty intervals were not available for the other predictor variables. Nonetheless, this provides a weight that indexes the level of certainty around the GBD project estimates for the relevant countries and years.
Total fertility rate
The GBD total fertility rate (TFR) measures the average number of children a woman would have over her lifetime if she were to experience the age-specific fertility rates prevailing in that year. GBD estimates fertility for females aged from 10 to 54, which is why the probability of death for women in that age range is used as the indicator of adult female mortality risk.
Fertility under 25
The total fertility for women aged 25 and under will be used as an indicator of earlier fertility. This has already been calculated for use in prior analyses and is available via the GBD results tool (Roth et al., Reference Roth, Abate, Abate, Abay, Abbafati, Abbasi, Abbastabar, Abd-Allah, Abdela, Abdelalim, Abdollahpour, Abdulkader, Abebe, Abebe, Abebe, Abejie, Abera, Abil, Abraha and Murray2018). While it is difficult to decide what should be defined as “early fertility,” age 25 has been previously defined as a watershed in studies of reproductive timing in developed countries (Beaujouan, Zeman, & Nathan, Reference Beaujouan, Zeman and Nathan2023; Rosenbaum, Reference Rosenbaum2020).
Data processing and analysis were done using R version 4.5.0 (R Core Team, 2024). A preregistration with full details of the analysis, data, and data processing scripts can be found on the Open Science Framework at https://osf.io/ckfb4/.
Results
Descriptive statistics are shown in Table 1. The results of the first panel regression (Table 2) indicate that, as predicted, child mortality is a stronger predictor of TFR than is adult female mortality, thus supporting prediction 1. Prediction 2, however, is not supported, as adult female mortality was neither a significant predictor of TFR nor of under-25 fertility (see Table 2). In both models, there was a negative effect of child and maternal malnutrition exposure, demonstrating that greater exposure reduces fertility, in line with Ellis et al. (Reference Ellis, Reid and Kramer2024)’s two-tier model.
Descriptive statistics for the variables included in the analyses. Averages are for all 204 countries and territories over the 32 years from 1990 to 2001
Results for panel regressions with robust standard errors from two separate models: the model on the left predicting total fertility rate (TFR) and the model on the right predicting fertility to women under 25 years of age
Note. Robust standard errors are clustered by country for both models.
Significance thresholds: *** < 0.001, **<0.01, * < 0.05.
Discussion
The findings of this analysis support Ellis et al. (Reference Ellis, Reid and Kramer2024)’s assertion that child, rather than adult, mortality should predict offspring quantity. Findings are less conclusive regarding their second statement that premature death among prime-age adults should engender a shift toward current over future reproduction. In this analysis, the probability of death among females of reproductive age did not predict fertility to women under 25 (see Table 2, Figure 1). However, there are limitations to the analyses I present here. While the methodology underlying the GBD project data is extremely rigorous, there have been numerous critiques regarding cross-country analyses of aggregate data, which are prone to issues such as the ecological fallacy and Simpson’s Paradox (Kievit et al., Reference Kievit, Frankenhuis, Waldorp and Borsboom2013; Salkeld & Antolin, Reference Salkeld and Antolin2020). Future studies may overcome these limitations by combining individual-level fertility data with indices of local ecology and individual-level risk perception data.
Time series plots showing changes in key variables over time for the 204 countries and territories.
Acknowledgements
Thank you to the members of the Northumbria University Perception Evolution and Behaviour Lab (PEBL) who gave their comments and feedback on the preregistration of the analyses that I present in this paper.
Financial support
This research received no specific grant from any funding agency, commercial, or not-for-profit sectors.
Competing interests
The author declares none.