





No CrossRef data available.
Article contents
The two-tier model: an unbalanced view
Published online by Cambridge University Press: 11 November 2025
Abstract
ER&K recurrently emphasize one side of three equations: (1) extrinsic rather than intrinsic mortality pressures; (2) developmental rather than genetic influence; and (3) individual rather than population-level effects. Furthermore, they insufficiently disambiguate extrinsic from intrinsic mortality, especially confounding how mortality evolutionarily constrains and developmentally calibrates genotypic life history speed, and struggle to explain population-level differences in fast maturation among modern populations.
Information
- Type
- Open Peer Commentary
- Information
- Copyright
- © The Author(s), 2025. Published by Cambridge University Press
References
Belsky, J., Schlomer, G. L., & Ellis, B. J. (2012). Beyond cumulative risk: distinguishing harshness and unpredictability as determinants of parenting and early life history strategy. Developmental Psychology, 48(3), 662.10.1037/a0024454CrossRefGoogle ScholarPubMed
Dańko, M. J., Burger, O., & Kozłowski, J. (2017) Density-dependence interacts with extrinsic mortality in shaping life histories. PLoS ONE, 12(10), e0186661.10.1371/journal.pone.0186661CrossRefGoogle ScholarPubMed
Ellis, B. J., Abrams, L. S., Masten, A. S., Sternberg, R. J., Tottenham, N., & Frankenhuis, W. E. (2022). Hidden talents in harsh environments. Development and Psychopathology, 34(1), 95–113.10.1017/S0954579420000887CrossRefGoogle ScholarPubMed
Ellis, B. J., Figueredo, A. J., Brumbach, B. H., & Schlomer, G. L. (2009). Fundamental dimensions of environmental risk: the impact of harsh versus unpredictable environments on the evolution and development of life history strategies. Human Nature, 20, 204–268.10.1007/s12110-009-9063-7CrossRefGoogle ScholarPubMed
Ellis, B. J., Figueredo, A. J., Brumbach, B. H., & Schlomer, G. L. (2009). Fundamental dimensions of environmental risk: The impact of harsh versus unpredictable environments on the evolution and development of life history strategies. Human Nature, 20, 204–268.10.1007/s12110-009-9063-7CrossRefGoogle ScholarPubMed
Figueredo, A. J., Cabeza de Baca, T., & Richardson, G. B. (2020). Hybrid behavior-genetic models of the confounding gene-environment correlations in the development of life history strategy: Two convergent approaches. Journal of Methods and Measurement in the Social Sciences, 11(1), 1–24.10.2458/v11i1.23914CrossRefGoogle Scholar
Figueredo, A. J., & Rushton, J. P. (2009). Evidence for shared genetic dominance between the general factor of personality, mental and physical health, and life history traits. Twin Research and Human Genetics, 12(6), 555–563.10.1375/twin.12.6.555CrossRefGoogle ScholarPubMed
Figueredo, A. J., Vásquez, G., Brumbach, B. H., & Schneider, S. M. R. (2004). The heritability of life history strategy: the K-factor, covitality, and personality. Social Biology, 51, 121–143.Google ScholarPubMed
Hertler, S. C., Figueredo, A.J., Peñaherrera-Aguirre, M., Fernandes, H.B.F., & Woodley of Menie, M.A. (2018). Life history evolution: A biological meta-theory for the social sciences. Palgrave Macmillan.10.1007/978-3-319-90125-1CrossRefGoogle Scholar
Love, A. C., & Wagner, G. P. (2023). Stress, harshness, and evolutionary history. Trends in Ecology & Evolution, 38(10), 903–904.10.1016/j.tree.2023.05.013CrossRefGoogle ScholarPubMed
Maranges, H. M., & Strickhouser, J. E. (2022). Does ecology or character matter? the contributions of childhood unpredictability, harshness, and temperament to life history strategies in adolescence. Evolutionary Behavioral Sciences, 16(4), 313.10.1037/ebs0000266CrossRefGoogle Scholar
Moorad, J., Promislow, D., & Silvertown, J. (2019). Evolutionary ecology of senescence and a reassessment of Williams’ ‘extrinsic mortality’ hypothesis. Trends in ecology & evolution, 34(6), 519–530.10.1016/j.tree.2019.02.006CrossRefGoogle Scholar
Volk, A. A. (2023). Historical and hunter-gatherer perspectives on fast-slow life history strategies. Evolution and Human Behavior, 44(2), 99–109.10.1016/j.evolhumbehav.2023.02.006CrossRefGoogle Scholar
Williams, G. C. (1957). Pleiotropy, natural selection, and the evolution of senescence. Evolution, 11, 398–411.10.1111/j.1558-5646.1957.tb02911.xCrossRefGoogle Scholar
World Health Organization - Global Health Observatory. (2025). Share of children and adolescents who are overweight or obese, 2022. Retrieved from August 03, 2025. https://ourworldindata.org/grapher/child-adolescent-obesity
Google Scholar
Zhang, X., Schlomer, G. L., Ellis, B. J., & Belsky, J. (2022). Environmental harshness and unpredictability: Do they affect the same parents and children?. Development and Psychopathology, 34(2), 667–673.10.1017/S095457942100095XCrossRefGoogle ScholarPubMed
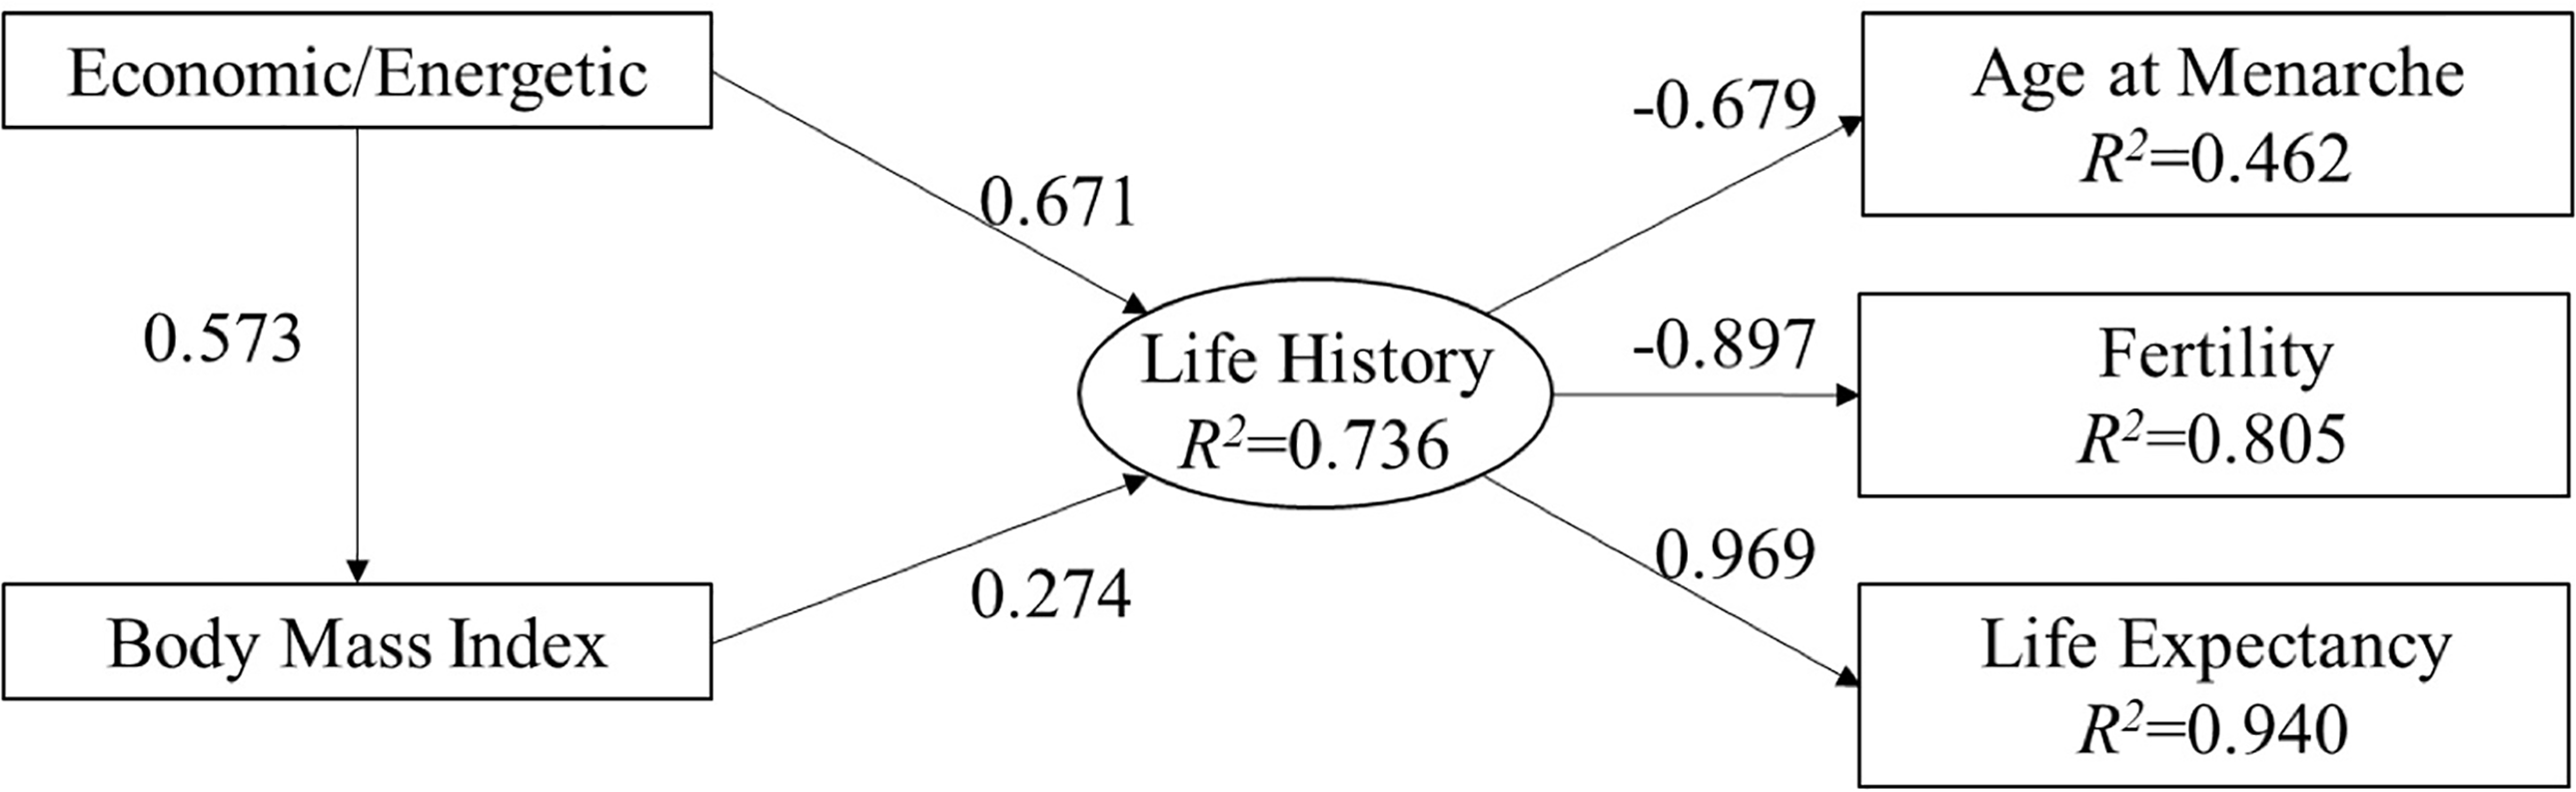
Figure 1. Structural equations model examining the influence of economic/energetic resources and BMI on a general life history factor. All covariances, paths, and loadings are statistically significant at p < 0.01.
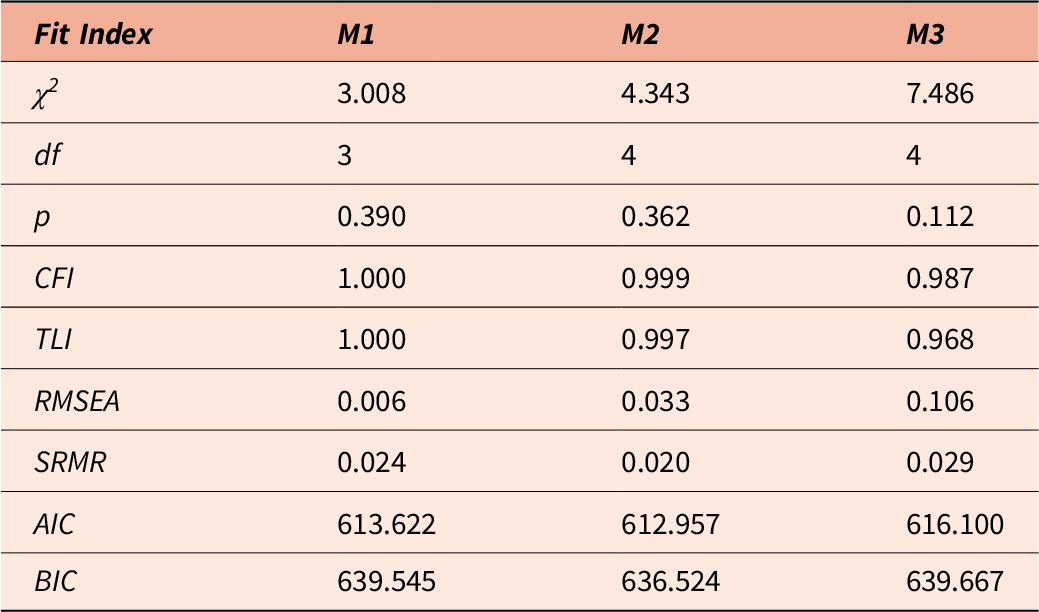
Table 1. Comparison of fit indices across alternative models
Target article
Related commentaries (29)
Density slows, while pathogens and disasters accelerate life history within populations
Hierarchical response models: new perspectives on development
The mortality-fertility relationship from the economic demography perspective
 You have
Access
First, extrinsic mortality is sufficiently defined but insufficiently disambiguated from intrinsic mortality. Although ER&K note that effort and time can reduce some extrinsic mortality threats, mortality threats are still considered extrinsic because effort and time do not bring sufficient return on investment. Precisely from this logic, a mortality threat can progress from extrinsic to relatively more intrinsic in certain contexts, cultures, and times. Advances in weaponry, food storage, and medicine, respectively, render predation, starvation, and infection relatively more intrinsic within modern, industrialized societies (Hertler et al., Reference Hertler, Figueredo, Peñaherrera-Aguirre and Fernandes2018).
ER&K try to reconcile their ideas with that of Volk (Reference Volk2023), who implicitly describes both intrinsic and extrinsic pressures. Harshness was originally defined more exactly (Ellis et al., Reference Ellis, Figueredo, Brumbach and Schlomer2009) but has been used more loosely in derivative literature (Belsky, Schlomer, & Ellis, Reference Belsky, Schlomer and Ellis2012; Zhang et al., Reference Zhang, Schlomer, Ellis and Belsky2022; Ellis et al., Reference Ellis, Abrams, Masten, Sternberg, Tottenham and Frankenhuis2022), largely subsuming both intrinsic and extrinsic mortality (Belsky, Schlomer, & Ellis, Reference Belsky, Schlomer and Ellis2012; Maranges & Strickhouser, Reference Maranges and Strickhouser2022; Love & Wagner, Reference Love and Wagner2023) and facilitating unfortunate claims and counterclaims about energetics. ER&K erroneously represent energetic constraints as invariably a source of extrinsic mortality, which then sometimes speeds and sometimes slows life histories (Ellis et al., Reference Ellis, Figueredo, Brumbach and Schlomer2009). Extrinsic mortality invariably speeds life history, but energetic constraint is not invariably an extrinsic mortality pressure. Energetic constraints can be highly extrinsic, as in an unprecedented famine, but can be highly intrinsic, as when seasonal cold cyclically constrains food sources.
Second, ER&K make no sharp distinction between extrinsic mortality as it evolutionarily constrains genotypic life history speed and as it developmentally calibrates life history speed within those evolved, biologically prepared parameters. Previously, Ellis and colleagues (2009) recognized that genetic evolution as well as phenotypic development were influenced in various ways by extrinsic mortality, affecting genetic evolution over multiple generations but phenotypic development within individual lifespans. The current narrative, however, has drifted entirely toward environmental effects and tended to ignore genetic ones despite the fact that effects of extrinsic mortality upon life history traits were originally introduced as genetic evolutionary and not developmental ones (Williams, Reference Williams1957), and much contemporary work in biology continues to reflect this evolutionary-genetic theoretical basis (Dańko, Burger, & Kozłowski, Reference Dańko, Burger and Kozłowski2017; Moorad et al., Reference Moorad, Promislow and Silvertown2019).
The heritability of life history strategy has been well established and documented for some time (e.g., Figueredo et al., Reference Figueredo, Vásquez, Brumbach and Schneider2004; Figueredo & Rushton, Reference Figueredo and Rushton2009), with estimated heritability coefficients ranging from h 2 = .60 to h 2 = .70. Certain environmentally determinist models of life history development, such as the Adaptive Calibration Model (ACM), are seriously confounded by gene-environment correlations, systematically overestimating the magnitude and significance of environmental causal pathways by ignoring and underestimating the genetic ones. Genetically informative designs (Figueredo, Cabeza de Baca, & Richardson, Reference Figueredo, Cabeza de Baca and Richardson2020) have shown that once genetic effects on life history are statistically controlled, various structural pathways from predictors such as parental instability (problematical parental drinking, drug abuse, and residential and marital instability) and parental abuse (emotional, physical, and severe abuse) to offspring adult life history are rendered nonsignificant. The phenotypic correlations between parental abuse and offspring adult life history are entirely spurious, and those between parental instability and offspring adult life history are partially so, with the effect size reduced but not entirely abolished. These findings are robust across analytical methods.
Third, ER&K reported a structural model that exhibited an acceptable statistical fit but may be overfitted and is not the most parsimonious one that fits the data. Although controlling for child and adolescent obesity share (World Health Organization, 2025) renders the correlation between life expectancy and age at menarche nonsignificant (r = −0.28, p = 0.06), we proceed to compare their model to rival structures.
ER&K predicted mean age at menarche using the following predictors: (1) economic/energetic resources (EE); (2) BMI; (3) life expectancy; and (4) fertility. This model strongly suggested that life expectancy partially mediates the effect of EE and BMI on mean age at menarche as well as fertility. Using the same data, we replicated their model (M1), obtaining similar results, but also considered an alternative model (M2) featuring a latent life history factor that loaded onto life expectancy, fertility, and mean age at menarche and was predicted by both EE and BMI. M2 featured an adequate statistical fit, and the modification indices revealed no need for further theoretically based improvements. Figure 1 displays the path diagram for M2.
Structural equations model examining the influence of economic/energetic resources and BMI on a general life history factor. All covariances, paths, and loadings are statistically significant at p < 0.01.
Comparison of fit indices across alternative models
Note: M1 is the model reported by ER&K; M2 is the optimal model, featuring the latent variable for life history strategy; M3 is the respecified ER&K model, removing the negative pathway between EE and Fertility that was included by ER&K to improve the fit of the model without any clear theoretical justification.
Although M1 is preferable based on absolute fit indices, the trivial difference in fit (ΔCFI < 0.01), combined with a similar AIC between models and a lower BIC in the alternative model, indicates that M1 may be overfitted. The inclusion of EE as a predictor of fertility, purportedly to control statistical suppression (increasing the proportion of explained fertility variance by only 1.4%), probably produced the discrepancy between absolute and parsimony-based indices that removing this parameter resolves.
Comparing this reduced model (M3) with M2 once again supports M2 over M3 based on both AIC and BIC values, further calling into question the theoretical necessity of a two-tier model of mortality. M2 is more theoretically consistent with previous work that has shown that the various indicators of life history strategy are genetically and not just phenotypically correlated (e.g., Figueredo et al., Reference Figueredo, Vásquez, Brumbach and Schneider2004; Figueredo & Rushton, Reference Figueredo and Rushton2009), thus rendering it less likely that they are the causal relations represented in M1 or M3. Table 1 displays fit indices for all three models.
Financial support
The authors declare no funding or financial support.
Competing interests
The authors declare no competing interests.