To save content items to your account,
please confirm that you agree to abide by our usage policies.
If this is the first time you use this feature, you will be asked to authorise Cambridge Core to connect with your account.
Find out more about saving content to .
To save content items to your Kindle, first ensure no-reply@cambridge.org
is added to your Approved Personal Document E-mail List under your Personal Document Settings
on the Manage Your Content and Devices page of your Amazon account. Then enter the ‘name’ part
of your Kindle email address below.
Find out more about saving to your Kindle.
Note you can select to save to either the @free.kindle.com or @kindle.com variations.
‘@free.kindle.com’ emails are free but can only be saved to your device when it is connected to wi-fi.
‘@kindle.com’ emails can be delivered even when you are not connected to wi-fi, but note that service fees apply.
A goal of atmospheric chemistry is to deepen our understanding of the underlying mechanisms at work in regulating the atmosphere’s chemical composition. To do so requires identifying chemical and physical processes that govern the origin and fate of chemical substances derived from both anthropogenic and natural emissions. How do we gain this information about chemical changes in our atmosphere? What technologies and techniques can we use? How do we know we can trust the acquired data? And what do we do with the information after acquiring it?
The complex interplay among chemical composition, meteorological factors, and transport processes complicates deciphering chemistry in the atmosphere. Three indispensable pillars exist to help us: observational measurements, laboratory investigations, and atmospheric modeling. These pillars synergize with one another to advance our understanding of the production, evolution, and removal of chemical species in the atmosphere. They can also reveal novel chemical phenomena and help us understand the photochemistry unique to the various regions of the atmosphere.
In this chapter, we concentrate on direct observational measurement of the atmosphere, including the methodologies employed in field measurements and the techniques used to gather experimental insights into the composition and chemistry of the atmosphere.
Melt ponds are puddles of water on Arctic summer sea ice that play an important role in the Arctic climate system, mainly through their influence on the surface energy balance. The albedo of polar oceans is primarily determined by the area fractions of sea ice and darker open ocean. However, the presence of melt ponds also significantly reduces the reflective properties of sea ice. This allows more solar energy to be absorbed, accelerating regional ice melt in a phenomenon known as ice-albedo feedback. Despite their importance, there is a lack of observational datasets that explicitly parameterize melt ponds next to sea ice and open water, and the existing data are mainly based on optical imagery. In this study, we present a new helicopter-borne dataset based on (TIR) and employ a deep learning-based semantic segmentation approach to classify surface types (melt ponds, sea ice, and open water). We evaluate the performance of several model architectures: U-Net, UNet++, PSPNet, DeepLabV3+, SwinTransformer, SAM2-UNet, and AutoSAM. Among these models, UNet++ pre-trained on the AID dataset demonstrates the highest performance, achieving a melt pond (IoU) of 0.486, a sea ice IoU of 0.764, and an open water IoU of 0.660. Furthermore, we apply the most effective model to the datasets of five helicopter flights, resulting in (MPF) estimates with a bias of approximately 11%, which is higher than for melt pond classifications based on visible observations.
This study presents a methodology for measuring complex electric permittivity of snow in the 200 MHz–2 GHz frequency range using resonant probes connected to a portable vector network analyzer (VNA). The methodology was applied during two field campaigns performed in the Alps in June and July 2024 under dense wet snow conditions. Snow liquid water content (LWC) and density were retrieved from dielectric measurements and compared with reference values obtained by melting calorimetry and gravimetric sampling, respectively. Two in situ protocols were adopted: a vertical profiling approach in June and a co-located acquisition protocol in July, in which dielectric, calorimetric and gravimetric measurements were performed at the same sampling points. Complex permittivity values measured by the VNA were compared with predictions from different models available in the literature, using reference LWC and density values as inputs. The results indicate that the Sihvola and Tiuri model provides one of the most consistent overall agreements with the experimental data and highlights the importance of co-located acquisitions for reducing the impact of spatial heterogeneity. The proposed methodology represents a field-deployable evolution of traditional snow dielectric measurements, providing encouraging results for LWC estimation while indicating the need for further validation of density retrievals.
With the ongoing effects of global warming, Antarctic supraglacial meltwater plays a critical role in ice-sheet instability. Spaceborne remote sensing provides a viable solution to detect surface melt in these vast and remote regions. Innovative deep learning image segmentation methods have the potential to improve supraglacial lake (SGL) mapping by adding spatial awareness to the mapping process, as currently established methods only consider the spectral variety of multispectral satellite data (Sentinel-1 and Landsat-8) on a per-pixel basis. In this study, we adapt a U-net image segmentation method to detect SGLs in Sentinel-2 data and quantify its performance in comparison to established mapping approaches in Antarctica. At a 90% probability threshold, the proposed workflow achieves a producer’s accuracy, user’s accuracy, and an F1 score of 0.915, 0.912, and 0.913, respectively. We compare the classification results to those of an established Random Forest classifier, and find that the U-net achieves better results in 13 of the 16 validation scenes. In a relative comparison with five established SGL products, the U-net approach maps, on average, the largest lake area, although there is disagreement between the datasets due to different data sources, cloud cover, and misclassification of some clouds as lakes. The main advantages of the developed approach are its capabilities to map lakes under thin clouds and ice, resulting in more continuous lake areas than conventional approaches, and a reduced number of input features required, which will be advantageous in future large-scale SGL mapping efforts.
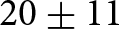
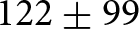
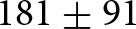
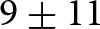
Glaciers are critical freshwater reservoirs in the Central Andes. Although supraglacial debris covers over 40% of the glacierised area in the Atlantic basins, the long-term surface evolution of debris-covered glaciers remains poorly constrained. In this study, we quantify glacier surface evolution over four decades (1985–2024) for 229 debris-covered glaciers across five major Atlantic basins in the Central Andes. Using ANDESMAG, a Python-based decision-tree algorithm employing spectral thresholds, we analysed more than 60 000 Landsat and Sentinel-2 image tiles in Google Earth Engine. Overall, debris-covered area increased by $20\pm11$% and debris-emergence elevation rose by $122\pm99$ m, while snowline altitude at the end of summer increased by $181\pm91$ m and snow-cover ratio declined by $9\pm11$%. Most of these changes occurred after 2009, during the Central Andes Megadrought, and correlated more strongly with declining precipitation than with rising air temperature. Our open-access workflow, which achieves a classification accuracy of 94%, provides the first annual regional assessment of debris-covered glacier surface evolution in the Central Andes of Argentina. Our results highlight the vulnerability of debris-covered glaciers to ongoing climate change and offer a transferable tool applicable to glacierised mountain regions worldwide.
Despite its record among early twentieth-century explorers and being one of the first sites excavated in southwestern Petén, Guatemala, Altar de Sacrificios has eluded Maya scholarship for much of the last half-century. This article aims to redefine Altar’s position on the ancient Maya geopolitical landscape and reconsider its role in socioeconomic exchange during the Classic period (ca. AD 200–900). We report new findings from a unmanned aerial system survey of the Upper Usumacinta Confluence Zone, contextualizing our results with other remote sensing surveys across the Maya lowlands. By examining the size, form, and distribution of settlement across this fluvial landscape, we characterize variable patterns of settlement density and organization in relation to shifting river channels and potential land use practices associated with Altar’s Classic period occupation. Synthesizing these patterns and population estimates with data from other well-documented settlements across the Maya lowlands, this study highlights the diversity of this ancient urban tradition and contributes to broader discussions on Maya urbanization—especially the connections between cities and more rural zones of human habitation.
Stream water temperature strongly influences aquatic ecosystem health, affecting dissolved oxygen, species distributions, and thermal stress for sensitive taxa. We present a data-driven framework to predict water temperatures across rivers in the Canton of Vaud, Switzerland, explicitly quantifying the influence of riparian vegetation. Meteorological and topographic features were extracted at each water temperature station. Vegetation features were derived from satellite imagery data, using Vegetation Height Models (VHM) and Specific Leaf Area Vegetation Index (SLAVI), and aggregated along upstream river segments to capture the influence of riparian zones on water temperature. These features were incorporated into a machine-learning model using grouped inputs with Softmax-based weighting for meteorology and a Gaussian attention layer for vegetation. Spatial cross-validation ensured realistic generalization. The model achieves a median mean absolute error of 1.3 °C for daily 90th percentile water temperatures. Model analyses show that dense riparian vegetation can reduce predicted stream temperatures by nearly 3 °C on warm days. Moreover, the spatial influence of vegetation varies with river slope: in flatter reaches, vegetation close to the water temperature station exerts the strongest cooling effect, whereas in steeper reaches, vegetation located further upstream becomes more influential, consistent with faster flow transporting thermal signals downstream. These results underscore the importance of incorporating spatially explicit riparian vegetation metrics in predictive models. The framework offers actionable insights for river management, showing that targeted riparian preservation or restoration, even in narrow corridors, can effectively mitigate thermal stress and support climate adaptation strategies.
Ground-penetrating radar (GPR) is a vital tool in archaeology, facilitating the planning of excavations while minimizing their impact. However, its application in the Northern Maya Lowlands of Yucatán, Mexico, has historically encountered limited application due to the region’s distinctive geological conditions and issues related to technological precision. The region’s limestone substrates can interfere with GPR signals, complicating the differentiation between cultural features, natural formations, and radar anomalies. Nevertheless, advancements in GPR technology over the past two decades have mitigated these challenges. This article offers a case study from Yaxuná, Yucatán, concentrating on the Central Plaza during the Middle and Late Formative period (600 BC–AD 200). By integrating GPR data with documented stratigraphic features and site insights, the study successfully identified cultural elements, directed excavation efforts, and revealed previously unexamined structures, thereby enhancing planning efficiency. These findings underscore the potential of GPR to reduce excavation-related damage, thereby assisting archaeologists in better uncovering and preserving cultural heritage.
The retreat and acceleration of Greenland’s marine-terminating glaciers are linked to enhanced submarine melting driven by ocean warming. Despite the significance of these ice-ocean interactions, observations of ice-front proximal waters remain limited due to logistical challenges. Buoyant subglacial meltwater plumes entrain deep, warm Atlantic waters during their ascent. Using a plume model, we demonstrate that when these plumes reach the surface in deep fjords (>400 m), their surface temperatures can serve as a proxy for subsurface ocean temperature variability. Here, we optimise and validate a Landsat sea surface temperature algorithm for Arctic waters using in situ measurements, with an accuracy of ∼0.4°C for Landsat 5, 7, 8 and 9. Applying this method, we analyse plume surface temperatures at Sermeq Kujalleq (Store Glacier) from 1985 to 2024 and compare Landsat-derived plume surface temperatures with plume model simulations forced by in situ measurements and four ocean reanalysis products. The Landsat-derived plume surface temperatures are of the correct magnitude and reveal trends consistent with expected interannual ocean variability. While large seasonal variability and confounding physical processes still make it difficult to isolate the subsurface signal, our 40 year record suggests that plume surface temperatures could become a useful proxy for subsurface ocean change.
Supraglacial lakes on the Greenland Ice Sheet are becoming increasingly abundant, impacting the distribution and routing of surface runoff with implications for drainage system evolution and ice flow. Their dynamics are well understood in summer when optical satellite imagery provides effective monitoring; however, their distribution and impact are less clear in winter when monitoring is restricted by the 24-hour darkness of the polar night. Using Sentinel-1 C-band Synthetic Aperture Radar (SAR) time series from 2018 to 2019, we assess whether an unsupervised time series clustering approach can be used to identify dynamic lake processes in winter. Our results show that: 1) winter lakes can be detected with an 87.6% accuracy; 2) SAR backscatter time series can be used to automatically and accurately (75.0%) classify winter lake behaviour (freeze-through, buried, no winter lake presence) without training data; 3) the temporal backscatter pattern of winter lake behaviour is consistent across regions and years and therefore generalisable; and 4) individual lakes can exhibit multiple behaviours over winter. Our work underscores the need for methods that capture spatio-temporal complexities in SAR backscatter, and provides insights into how C-band backscatter can be used to contribute towards year-round monitoring of lake dynamics across Greenland.
Despite advances in global glacier modeling, notable uncertainties remain in part due to model overparameterization. We develop a novel Bayesian inference framework to calibrate the Python Glacier Evolution Model (PyGEM) against spatially distributed surface elevation change data. The utility of this framework is demonstrated using a 1994–2021 airborne laser altimetry record for 185 glaciers in Alaska, which altogether represent over half of the region’s glacier area. Calibration against these data reduces parameter uncertainty by 5–18% and lowers the mean absolute error in hindcast surface elevation change by 0.18 m a−1 (15% compared to prior models). Model projections for these 185 glaciers estimate mass loss ranging from 43 $ \pm $ 17% to 67 $ \pm $ 27% depending on the emissions scenario. The projections highlight considerable subregional variability ranging from a median glacier mass loss of 57–99% by the end of the century for Lake Clark, Denali, Kenai Fjords, and Glacier Bay national parks, compared to 28–51% lost for Wrangell–St. Elias National Park and Preserve. As additional spatially distributed elevation change datasets become available in Alaska and elsewhere, the framework presented here is well suited to further refine model calibration and improve projections, while remaining flexible to incorporate additional glacier change observations as they become available.
If crevasse fields deliver meltwater to the bed of the Greenland ice sheet, it would affect seasonal ice flow speeds and total mass balance. The best current automated tool to map crevasse fields extends only a few dozen kilometers inland. To address this gap, we develop MimiNet, a neural-network-based tool that identifies surface crevasse fields. We train MimiNet on Sentinel-1 scenes across a 629 km2 area in Pâkitsoq, central-western Greenland, and use it to locate crevasse fields annually over 2015–24. We find that the crevassed area varied from a minimum of 106 ± 5 km2 in 2019 to a maximum of 144 ± 6 km2 in 2016, with no overall trend over the 10 year study period. We find some evidence that seasonal ice velocity anomalies in crevasse fields are higher than those in moulin-drained areas in the late melt season. This may suggest that the subglacial drainage system under crevasse fields remains inefficient all summer, and thus that at least some Pâkitsoq crevasse fields deliver meltwater to the bed. Interannual variability in ice dynamics may drive the observed variability in crevassed areas; we expect crevasse extent to become more variable in time as ice flow speeds and their variations, amplify under climate change.
Formation and sudden drainage of glacial lakes pose increasing hazards in high-mountain regions, threatening downstream communities, infrastructure and ecosystems. Accurate bathymetric reconstruction and lake volume estimation are crucial for flood modeling, hazard assessment, and monitoring climate-driven glacial lake dynamics. This study uses a recently drained lake at the margin of Gornergletscher, Monte Rosa Massif, Western Alps, to reconstruct its bathymetry and estimate its volume by combining a high-resolution digital elevation model (DEM) from low-cost uncrewed aerial vehicle (UAV) imagery with multispectral Sentinel-2 data. The UAV data were used to generate an orthomosaic and a high-resolution DEM of the empty lake basin. Lake extents corresponding to five filling stages, together with the DEM, enabled pixelwise depth estimation, yielding a mean lake depth for maximal filling of 21.94 m and an estimated corresponding water volume of 0.298 ± 0.11 × 10⁶ m3. Field observations indicated direct glacier contact and subglacial drainage through vertical conduits. Sentinel-2 also revealed smaller lakes in 2017 and 2018. Comparative analysis of climate variables from lake (2017, 2018 and 2022) and no-lake (2019–21) years highlighted higher April–June temperatures as the dominant factor controlling lake formation. This study demonstrates the value of integrating UAV three-dimensional (3-D) terrain modeling with satellite remote sensing for high-resolution glacial lake monitoring.
The export of fresh water (solid and liquid) from glaciers and ice sheets plays an important role in the global climate system. Icebergs influence ocean salinity and circulation patterns and pose a growing hazard to Arctic navigation as sea ice cover declines. Therefore, quantifying the volume of icebergs calved from the Greenland ice sheet is essential. Here, we present iceberg size and volume distributions derived from high-resolution Satellite Pour l’Observation de la Terre (SPOT) images for Upernavik Isfjord, Northwest Greenland, during the 2020 open water season. The iceberg area–volume conversion is constrained by a 3D photogrammetric survey of icebergs within the fjord. By integrating glacier discharge over estimated iceberg residence times, we link remotely sensed iceberg volumes to calving rates at the primary outlet glaciers. We detected 343 769 icebergs with a total volume of 4.7 km$^3$. This corresponds to 88.7% of the estimated solid ice discharge and falls within the derived discharge range of 3.4–12.2 km$^3$. Uncertainties are primarily controlled by variability in residence time, extrapolation of the area–volume relationship beyond its calibration domain and assumptions regarding ice density.
Before Navan Fort became the mythological capital of the Irish province of Ulster, construction of the monumental Haughey’s Fort around 1200 BC marked the foundation of an important prehistoric centre. Here, the authors report on research integrating remote sensing, excavation and archival reassessment in the exploration of this Bronze Age landscape. Indicators of long-distance exchange and craft production of high-status artefacts, together with the presence of 204 possible structures and a ceremonial avenue leading towards a unique ritual pool, help elucidate the site’s social, economic and ritual importance, while identification of a 109ha enclosure underlines the exceptional scale of activities.
The Roman world was a rural world. In this pre-industrial society, the majority of the population – between 70 and 90 per cent – lived in the countryside and was to some degree active in agriculture.1 A large proportion of these rural dwellers had their immediate rural surroundings as their main social and economic frame of reference, with only minimal engagement with cities: they procured necessary supplies and services in local rural centres and sold off any (agricultural) surplus via low- and higher-frequency rural markets and fairs.
Dryland salinization and pasture degradation threaten livestock production in the Paraguayan Chaco, yet field-based ecohydrological assessments remain scarce as ranching is expanding into increasingly marginal environments. Bare land areas with <15% vegetation cover, locally called peladares, are increasingly emerging in the transformed landscapes of the Gran Chaco, leading to reduced rangeland productivity. We conducted a long-term analysis (2000–2025) of land-use change and spectral indices across a ~500,000 ha region in Boquerón, Paraguay, to assess whether these variables alone can explain the negative trend in NDVI (Normalized Difference Vegetation Index), or whether other unrelated factors contribute to their emergence. First, we identified bare land areas using a Random Forest classifier. Second, we analyzed when these areas were converted from native forest to pastures. In parallel, we evaluated whether peladares exhibit climate-aligned signals by analyzing long-term trends in NDVI (Landsat 7/8/9), evapotranspiration (MOD16A2GF) and a MODIS LST-based Crop Water Stress Index (CWSI; MOD11A2), using Sen’s slope. Finally, we used GAMs to remove cohort effects from NDVI trends and evaluated residual variation against salinity indices to rank their effectiveness as proxies for identifying peladares. This workflow provides a scalable baseline for screening secondary salinization risk and prioritizing field validation, pasture management and conservation planning in Chaco drylands.
Supraglacial lakes on Northeast Greenland Ice Stream glaciers (79N and Zachariæ Isstrøm) store and route meltwater to the bed, yet controls on their evolution and cascading drainage remain poorly understood. We mapped the lakes across contrasting 2019 (warm) and 2020 (normal) melt seasons using Sentinel-2 imagery, ArcticDEM and ICESat-2 altimetry with an empirically calibrated reflectance-depth model. Sustained warming in 2019 produced 10% larger peak lake area despite similar lake counts, showing cumulative temperature control on growth. The $ \lt 800\,\mathrm{m}$ elevation range hosted most number of lakes while gentle slopes ($ \lt 0.3^\circ$) stored largest volumes despite shallower depths. Of $\sim$600 rapid drainages detected, cascades (with $ \lt 3$ lakes per cluster over a spatial extent $ \lt 2.5\,\mathrm{km}$) dropped from 31% to 20% between years. Overall, our results demonstrate that variations in melt-season intensity could be a factor in modulating supraglacial lake persistence, drainage behaviour and cascading dynamics. These findings emphasize the importance of mid-elevation lakes as critical nodes in meltwater transfer and provide new insights into the understanding of surface water storage and surface-to-bed hydrological connectivity across the northeast Greenland ice margin.


Regional-scale glacier mass-balance (MB) estimates are essential for understanding the impacts of climate change on alpine hydrology but remain challenging to obtain. Remotely sensed phenology metrics, such as the cumulative melting index (CMI) derived from Moderate Resolution Imaging Spectroradiometer (MODIS) data, are increasingly used for MB estimation; however, the strength of this relationship varies across glaciers. This study analyzes the relationship between the MODIS-derived CMI and glacier annual MB across 88 alpine glaciers globally and investigates sources of variability. By standardizing CMI values, we reduce interglacier variability in CMI–MB relationship. Principal component analysis (PCA) and Gaussian mixture model are employed to classify glaciers into six climate-based clusters. Cluster-specific linear regression models improve MB estimation accuracy. When glacier predictions from the cluster-specific models are combined across all 88 glaciers worldwide, the overall root-mean-square error is 511.0 mm w.e., compared with 571.4 mm w.e. using a single regression model. Applied to 616 glaciers in the European Alps, the model estimates a 20 year (2002–21) annual average mass loss of −981.9 ± 11 mm w.e. a−1. These findings highlight the potential of MODIS-derived phenology metrics for scalable glacier MB estimation and emphasize the influence of regional climatic controls on glacier sensitivity to climate variability.
In July 1954, while making glacier mass-balance measurements in Northwest Greenland just below the boundary of the dry-snow facies, a team led by C.S. Benson documented a rain-on-snow event triggered by an atmospheric river. This produced extensive surface melt and notable ice layers, lenses and percolation columns in the snowpack that were tracked in subsequent years in snow pits dug nearby. Since 2000, numerous surface-melt events in the dry-snow facies have been documented by satellite observations. We compare and contrast the 1954 event with recent melt events to highlight challenges in monitoring melting in Greenland. Satellite sensors can accurately map melt extent across the ice sheet but cannot reliably quantify the melt intensity. Snow pit and ice core measurements can assess melt intensity but are too localized to capture melt extent. Reanalysis of the 1954 event adds an additional caveat: the extensive surface-melt event produced features only on two of the four sides of a large snow pit, evidence that the notable 1954 event could easily be missed in an ice core extracted years later. This suggests that analysis of historical melt events, using ice cores, probably underestimates both the spatial extent and temporal frequency of past melt events.